



What is AI observability? AI observability suite offers native, zero-code integration with widely adopted frameworks such as LangChain, LangGraph, Dify, and OpenAI. It automatically instruments the full execution path—from user request to final model response—capturing every intermediate step, tool invocation, and model call. With built-in metrics for token usage, step-wise duration, and conversational session tracing, operators can monitor, troubleshoot, and optimize AI application behavior with granular, actionable insights.
AI observability extends traditional distributed tracing into the AI application layer. Instead of only tracking service-to-service requests, it follows the complete execution journey of an AI workload — from user requests to prompts, model calls, tool invocations, and agent decisions. For agentic applications, this requires visibility at two levels: call chain analysis reveals the execution details of a single AI interaction, while session analysis provides a complete view of multi-turn conversations across multiple calls.
Distributed tracing solved a real problem for microservices: a slow request used to mean guessing which of a dozen services was the bottleneck, and tracing turned that guess into a lookup. Agentic applications introduce the same challenge at the AI workflow level — a single user question can trigger multiple tools, invoke different models, and execute a variable number of steps. A slow response alone does not reveal which part of the AI workflow caused the delay.
Two Views for One Trace
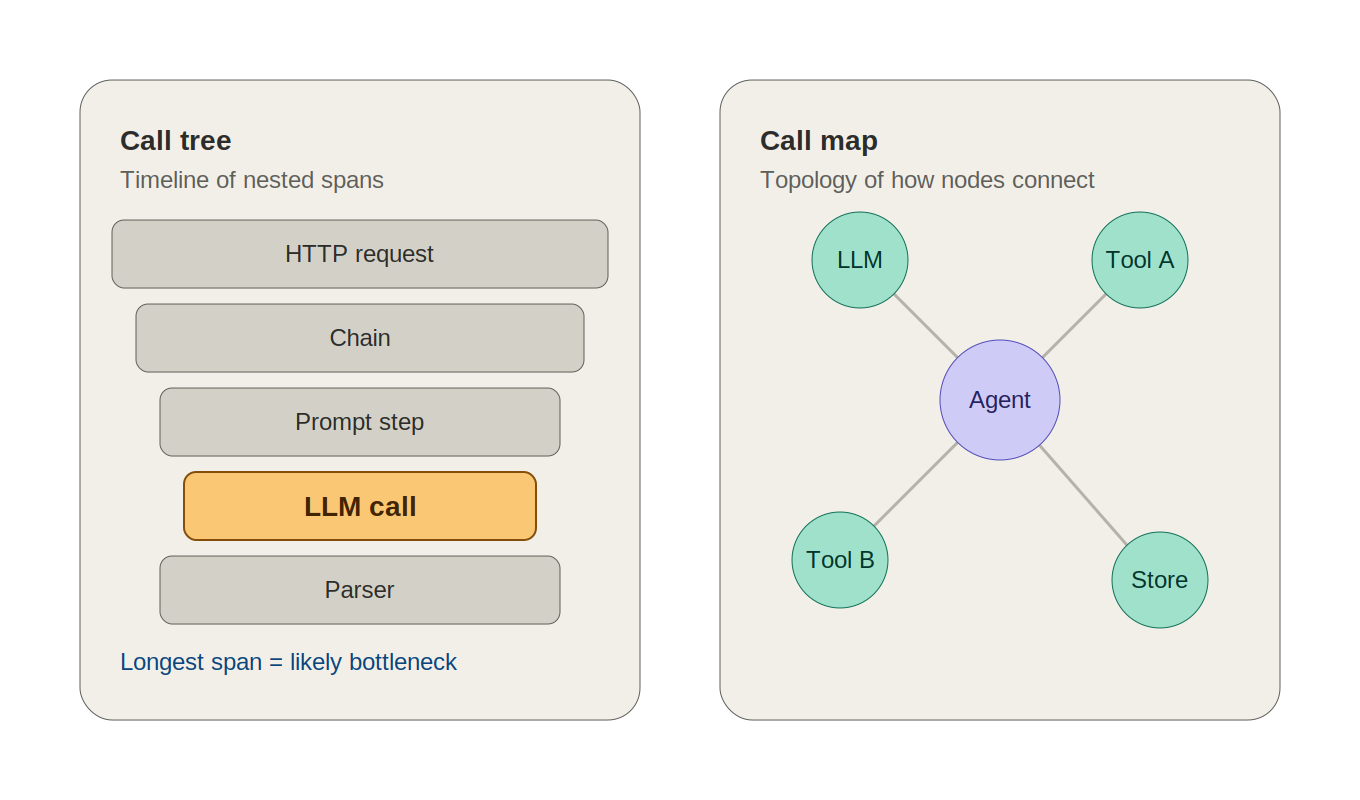
Call Tree lays out every span in a request as a hierarchy against a shared time axis — HTTP calls, chains, prompts, LLM invocations, parsers — so you can see not just what ran, but how long each piece took relative to everything else. Switching to LLM-only mode strips out the infrastructure spans and leaves just the model-calling layer: prompt content, token counts, latency per LLM call. That filter matters more than it sounds like it should, because in a chain with a dozen spans, the ones worth reading closely are almost always the two or three LLM spans, and the rest is noise you don’t want to scroll past every time.
Call Map takes the same trace and draws it as a graph instead of a timeline — each node showing average response time, request count, and error count. Where Call Tree answers “what took the time,” Call Map answers “how does this thing actually fan out” — useful the first time you’re looking at an unfamiliar agent chain and need the shape of it before you need the timing detail.
A Concrete Debugging Walkthrough
A request comes back at just over two minutes — noticeably slow. Call Tree, in ALL mode, shows the full hierarchy: an HTTP request wrapping a chain, wrapping a prompt step, an LLM call, a parser. Nothing obviously broken — until the time axis makes it visible that one span, llm ChatOpenAI, is eating the overwhelming majority of the two minutes. Clicking into that node surfaces its actual Input — and the prompt is enormous, several times longer than it should be for this operation. That’s the root cause: not a slow model, not a network issue, an oversized System Prompt. Nothing about the aggregate “response time: 121s” metric would have told you that; the node-level Input inspection is what did.
Switching that same trace to LLM mode would have gotten there faster by cutting straight to the two or three model-calling spans and skipping the HTTP and chain wrapper spans entirely — worth defaulting to once you already suspect the bottleneck is model-side rather than infrastructure-side.
Session Analysis: The Same Question, One Layer Up
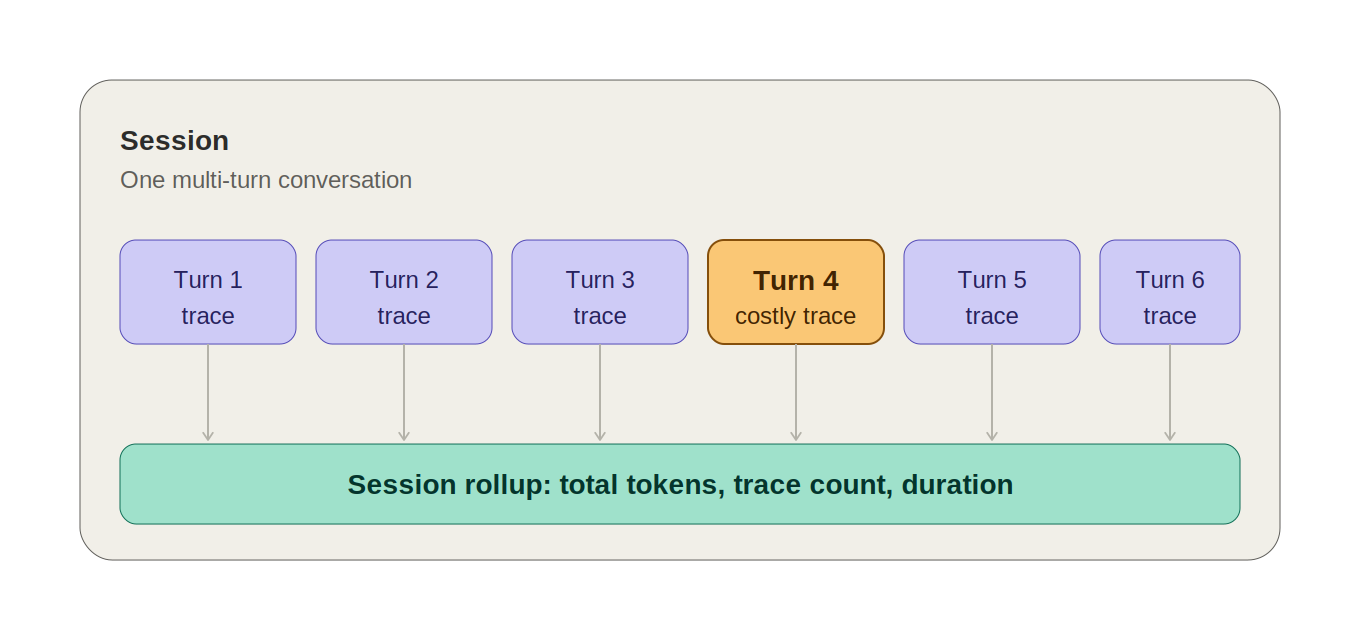
A single trace answers “what happened in this one call.” It can’t answer “which turn in this three-hour conversation is the one that drove the token bill up,” because that question spans multiple traces. Session analysis aggregates every trace inside a conversation — total token consumption, trace count, duration — then lists each turn with its own Input preview, response time, token split, and LLM/Tool call counts, so a session that ran six turns doesn’t require opening six separate traces to compare them.
Expanding one turn reveals a waterfall chart color-coded by span type (Agent, Chain, LLM, Task) and, below it, an agent collaboration topology for that specific round — which nodes ran, how long each took, how many tokens each consumed, how many times each was invoked. That combination answers the two questions that actually matter in a long agent session: which turn got expensive, and did the agent route the way it was supposed to, or did it take an unexpected path through the available tools.
Why This Needs Its Own Layer Instead of Just More Traces
The temptation is to say “session analysis is just filtering traces by session ID” — and mechanically, that’s not wrong. But the aggregation is the actual value: total-session token cost, trace-count, and duration at a glance are what let you triage which sessions are worth digging into before you open a single trace, the same way an APM service overview lets you triage which services are worth investigating before you open a single request.
How the Broader Market Approaches This
Datadog’s LLM Observability traces every agent step and bills specifically on LLM spans — deliberately leaving tool, embedding, retrieval, and agent spans unbilled — with an SDK that auto-instruments OpenAI, LangChain, AWS Bedrock, and Anthropic without requiring code changes. Dynatrace has leaned on its existing Causal AI and Smartscape topology to correlate agent tool usage and multi-agent communication with the rest of the dependency graph, rather than treating agent tracing as a separate silo from infrastructure tracing.
The underlying agreement across the market is the same one this piece has been arguing: tracing an agentic system means tracing below the request level, down to individual model and tool calls, and it means aggregating above the request level, up to the whole conversation — a single trace view alone answers neither “why was this slow” nor “why did this session get expensive” completely on its own.
FAQ
What’s the difference between Call Tree and Call Map?
Call Tree is a timeline — it shows how long each span took relative to the others, which is what you want when diagnosing latency. Call Map is a topology graph — it shows how nodes connect to each other, which is what you want when you’re unfamiliar with an agent chain’s structure and need the shape before the timing.Why would I need session analysis if I already have trace-level tracing?
A single trace only covers one turn of a conversation. Session analysis aggregates every trace in a multi-turn session so you can identify which specific turn drove up cost or latency, instead of only knowing the session overall was slow or expensive.What data does this depend on?
Call chain analysis depends on AI-call monitoring being enabled on the probe. Session analysis additionally depends on session attributes — session ID and user ID — being mapped and reported from the application’s request parameters; without that mapping, sessions won’t group correctly.Can I see the exact prompt sent in a specific call?
Yes — clicking into any node in Call Tree or Call Map opens a details panel with the full Input/Output content for that span, not just a summary.
Does LLM-only mode hide information I might need?
It hides infrastructure spans (HTTP, generic chain wrappers), not model-calling spans — useful once you already suspect the bottleneck is model-side, but worth switching back to ALL mode if the root cause turns out to be elsewhere in the chain.