



AI agent observability is the practice of collecting and correlating telemetry across an agent’s entire run, including model calls, tool executions, retrieval steps, agent handoffs and the infrastructure underneath, so that teams can explain what an agent did, why it did it, what it cost and whether the outcome was good. LLM tracing is one input to this picture, but on its own it is not enough for production agents.
Why LLM tracing alone falls short
An LLM trace records a prompt, a completion, token counts and latency for a model call. An agent run is something different: a sequence of decisions in which the agent plans, calls a tool, reads the result, calls the model again and repeats until it decides to stop. Most production failures sit between those calls rather than inside any single one: the wrong tool chosen, a tool that fails in a way that looks like success at the transport level, a retry loop, a context window that grows until answers degrade, or a cost that compounds with every extra step.
Six requirements for AI agent observability
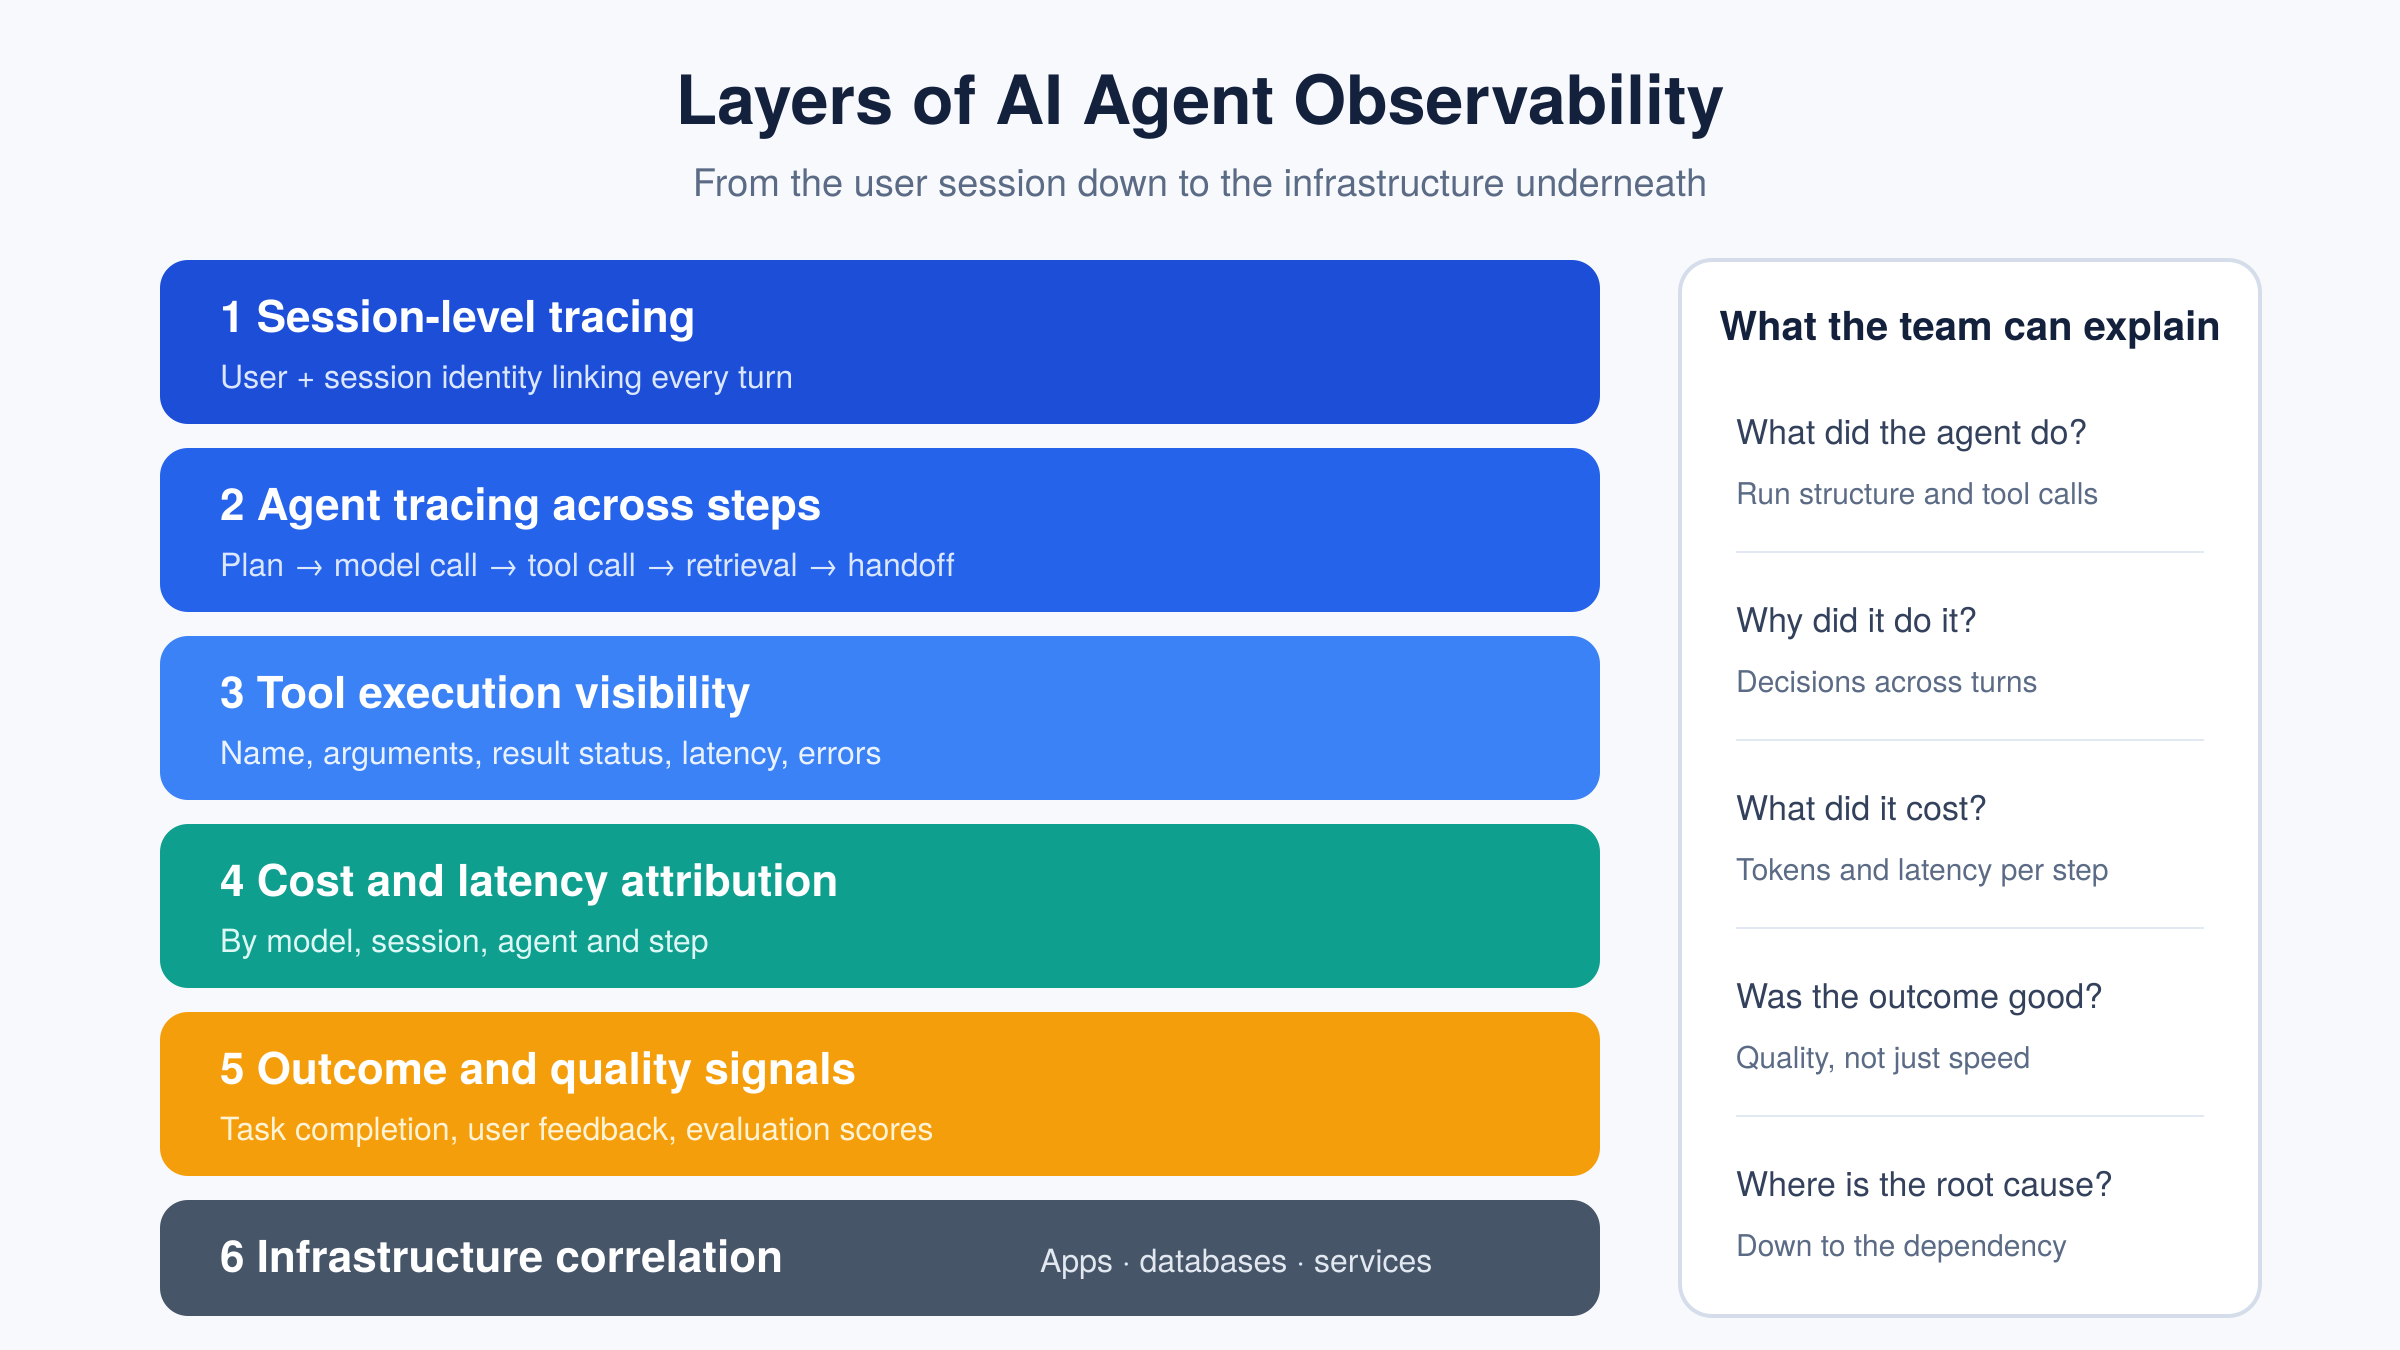
Session-level tracing. Agents work across multi-turn conversations. Telemetry must link every turn of a session with its user and session identity, so that a bad answer on turn six can be traced back to a decision on turn two.
Agent tracing across steps. Each run should be visible as a tree: planning, model calls, tool calls, retrieval, and handoffs between agents. This is what makes a run explainable.
Tool execution visibility. For every tool call, capture the tool name, arguments, result status, latency and errors. Pay particular attention to tool failures that are returned as ordinary results with an error flag inside them: they do not appear as failures in transport-level metrics unless you count them explicitly.
Cost and latency attribution. Token usage and latency should be attributable by model, session, agent and step, because cost problems in agents usually come from a few expensive sessions rather than from average behavior.
Outcome and quality signals. Task completion, user feedback and evaluation scores should be attached to traces, so that “this run was slow” can be separated from “this run was wrong.”
Infrastructure correlation. A slow tool is often a slow database or a saturated service. Agent telemetry should connect to the application and infrastructure telemetry underneath it, so that diagnosis does not stop at the agent boundary.
Failure patterns a model-only view misses
Failure pattern | What you need to see |
Silent tool failure | Tool result status and error flags counted per tool |
Retry loop | Number of steps per run and repeated identical calls |
Context growth | Input tokens per step across a session |
Wrong tool selection | Which tool was chosen, with the arguments and the result |
Slow downstream dependency | Tool latency correlated with the service or database behind it |
Cost spike | Token and cost attribution by session and agent |
Agent monitoring in production
Once the telemetry exists, agent monitoring turns it into signals worth alerting on: error rate per tool, steps per run, tokens per session, latency per step, and the share of runs that end without completing the task. Alert on changes in these distributions rather than on single events, because agent behavior is variable by nature.
What to look for in a platform
Session-aware views, not only isolated model-call traces
Tool-level detail, including how tool errors are counted
Per-model, per-session and per-agent cost views
Support for the agent frameworks your teams use
Correlation with application and infrastructure monitoring in the same product
Open instrumentation, so that telemetry is portable
How Bonree ONE addresses this
Bonree ONE AI Observability provides end-to-end tracing for LLM and agent calls, with call chain, session and token views, and visibility into token usage and cost. It traces agents built on LangChain, LangGraph, Dify and OpenClaw, and it sits on the same platform as application and infrastructure monitoring, so an agent’s behavior can be examined alongside the services it depends on.
FAQ
What is AI agent observability?
It is the ability to understand what an AI agent did across a whole run, from model calls and tool executions to cost and outcome, using correlated telemetry.
How is agent observability different from LLM observability?
LLM observability focuses on individual model calls: prompts, completions, tokens and latency. Agent observability adds the run structure, tool execution, sessions, handoffs and the infrastructure behind them.
What is session-level tracing?
It is tracing that links all turns of a multi-turn conversation under a shared session identity, so that behavior across turns can be analyzed as one unit.Why do tool failures often go unnoticed?
Some tool failures are reported inside a normal response, with an error flag in the result. Unless instrumentation reads and counts that flag, the call looks successful.
What should I alert on for production agents?
Error rate per tool, steps per run, tokens per session, latency per step and the share of runs that do not complete their task.