



Incident response is the most experience-dependent and labor-intensive part of day-to-day operations. When error rates spike, responses slow down, services go offline, applications crash, or pages start to lag, operations engineers typically have to check logs, analyze stack traces, compare metrics, and trace call chains before they can piece scattered information into a conclusion that holds up. The process depends heavily on individual experience, the troubleshooting path is long, and the conclusions are hard to reproduce or verify.
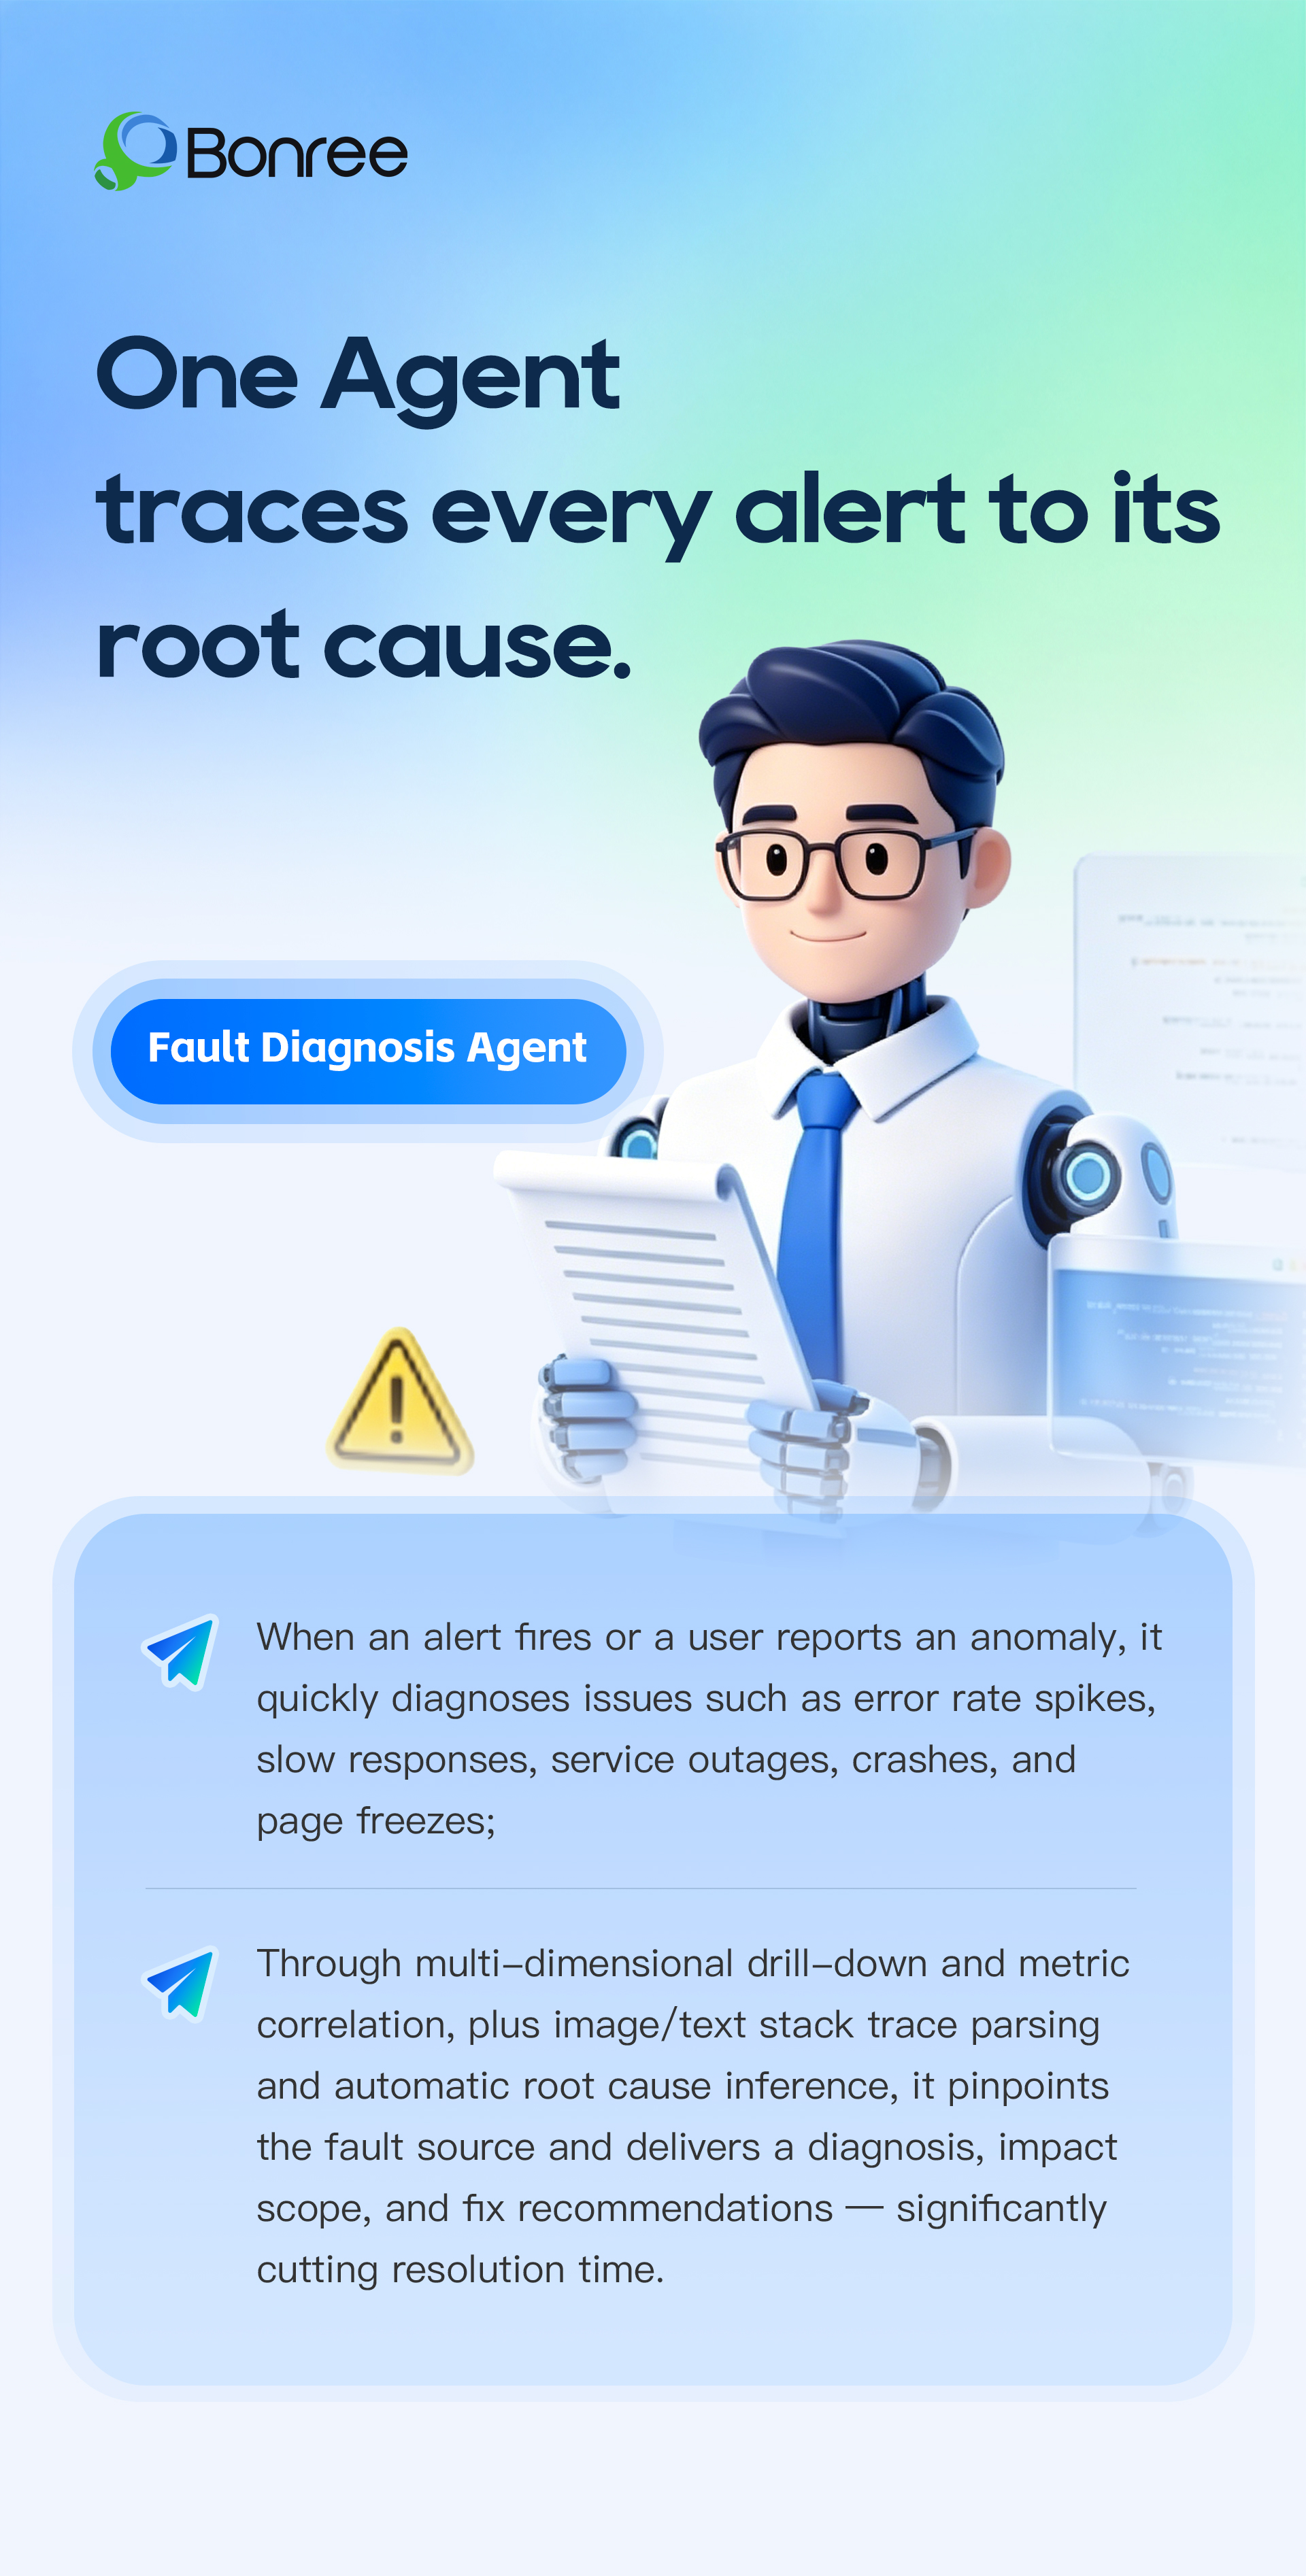
The Fault Diagnosis Agent in the Bonree ONE·Sage AI intelligent operations agent workbench automates this process. It builds on the full-stack observability data collected by Bonree ONE (metrics, logs, stack traces, call chains, and topology) to diagnose faults in the business systems, applications, and services an enterprise actually runs. It supports multi-dimensional drill-down and metric correlation analysis, parses stack trace information from images or plain text, classifies and attributes causes automatically, and delivers a diagnostic conclusion with remediation recommendations. Below is the complete diagnosis of a real alert.
Diagnose an Alert with One Sentence and Pinpoint the Root Cause Automatically
"High service request error rate – langchain_router_api – mcp-http request error rate – alert": please diagnose this alert.
Submit the raw alert text to the Fault Diagnosis Agent and diagnosis starts immediately. The agent first loads the alert-diagnosis skill and calls a tool to parse the alert profile file. It then runs an analysis script to reconstruct the full timeline of the incident.
Not a Vague Conclusion, but a Verifiable Chain of Evidence
Instead of a fuzzy judgment like "it's probably a problem somewhere," the Fault Diagnosis Agent produces a chain of evidence that can be verified item by item. It narrows the problem down to the service's /mcp request path and traces the two key errors to the exact error stack traces and code paths. It ranks multiple evidence chains by confidence and clearly labels the top one as the "primary cause candidate, highest confidence." It also identifies the six related entities affected by the alert and marks the health status of each, so the scope of impact is clear at a glance.
Beyond Finding the Cause: Telling You What to Do Next
The diagnosis doesn't stop at root cause identification. The agent also provides remediation guidance, listing priority items to investigate and executable commands for secondary verification. It adds long-term monitoring and contingency recommendations, such as how to adjust alert thresholds and which metrics should be watched together, to reduce the chance of similar incidents recurring. When the conversation ends, the interface offers several follow-up questions that can be asked with one click, so engineers can keep digging from the diagnosis results.
[Image]
What used to take hours of combing through logs and comparing metrics one by one is now condensed into a single conversation. The agent automatically handles the repetitive troubleshooting work: alert parsing, log investigation, stack trace analysis, metric comparison, and evidence chain construction. Fault localization time drops sharply, and operations engineers can spend more of their energy on root cause review, solution decisions, and fix verification.
✅ One-click trigger, shorter troubleshooting path
Alert information can be pasted or forwarded directly to start a diagnosis automatically, saving you from opening logs and checking monitoring dashboards one by one.
✅ Down into the code stack, not just metric guesswork
It parses stack trace information from images or plain text and pinpoints the exact code path where the error occurred, rather than making vague inferences from metric anomalies alone.
✅ A verifiable chain of evidence, not a single conclusion
For each alert, it builds multiple candidate evidence chains, ranks them by confidence, and clearly flags the primary cause candidate. The reasoning is fully traceable.
✅ Impact scope assessed at the same time
It automatically maps the services, instances, containers, processes, and hosts related to the alert and marks their health status, making the blast radius of the fault clear.
✅ Beyond diagnosis: verification and contingency plans
Along with the root cause conclusion, it provides executable verification commands and long-term monitoring recommendations, so the diagnosis can actually be acted on rather than ending as a report.
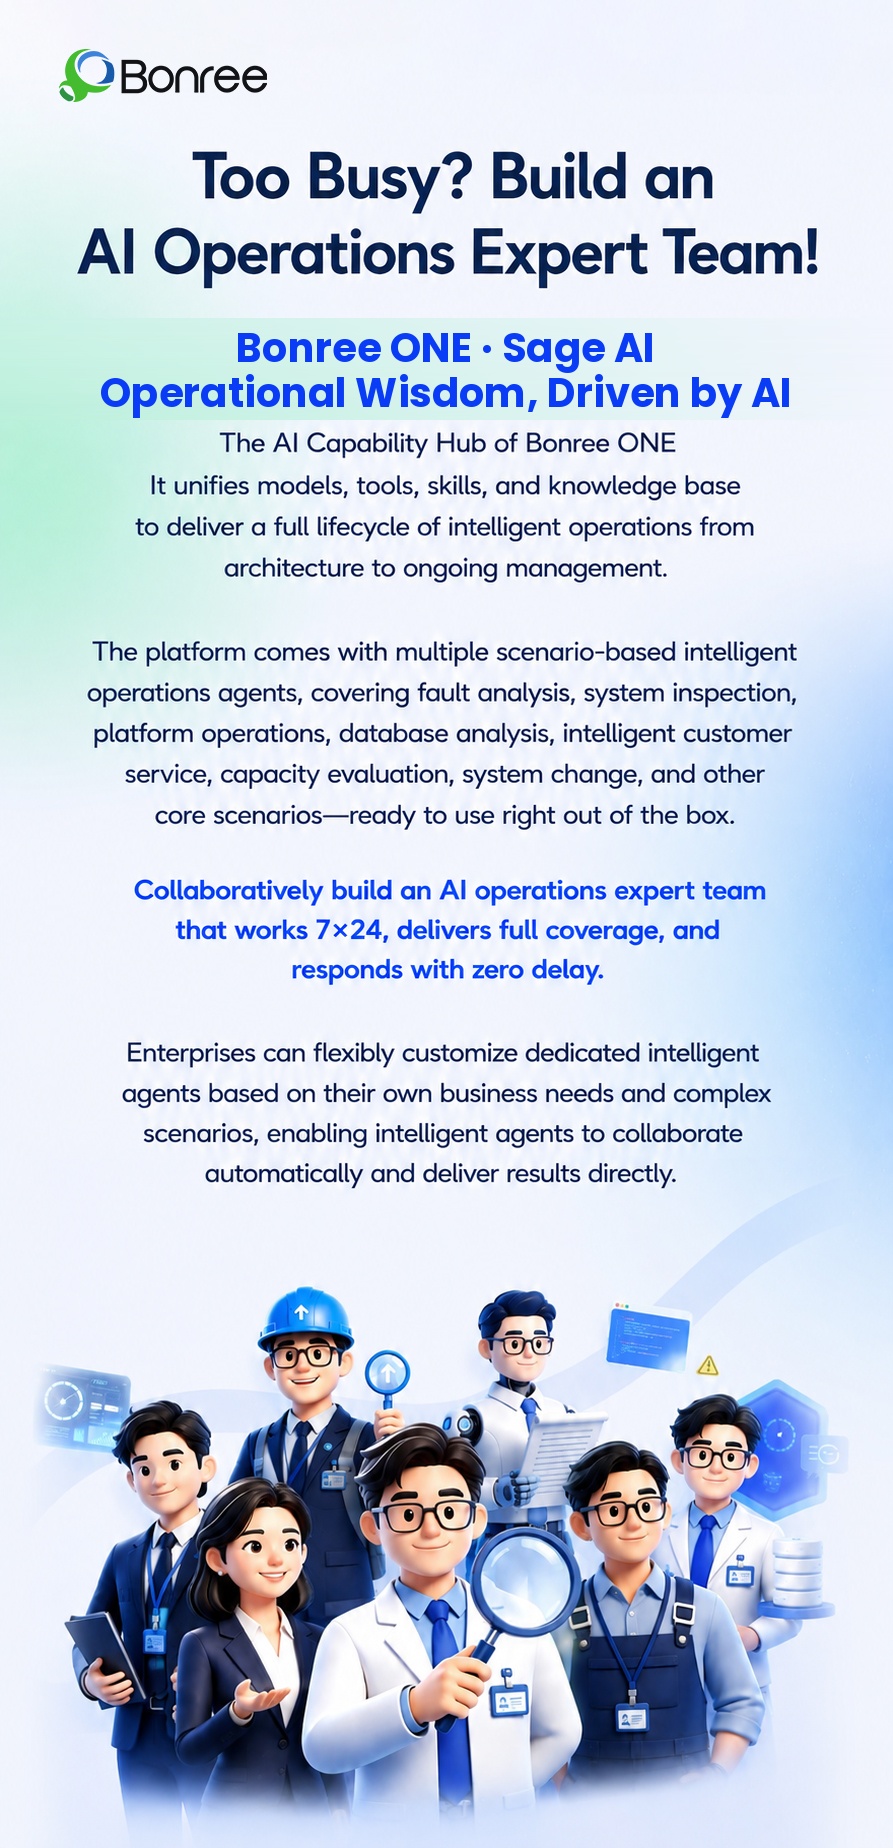
The Bonree ONE·Sage AI agent workbench already covers core operations scenarios including system inspection, fault analysis, platform operations, intelligent customer service, capacity agent, database analysis, and system change management. Analysis, judgment, and remediation skills that once depended on expert experience are being turned, step by step, into reusable intelligent operations capabilities for the enterprise. As more agents move into business scenarios, operations teams will gain more than faster incident response. They will gain a new way of working that keeps learning, supports decision-making, and drives the intelligent upgrade of operations.