



MCP observability is the ability to see, from telemetry alone, which Model Context Protocol tools an AI agent called, with what context, how long each call took and whether it succeeded, so that tool-call failures and slow MCP servers can be diagnosed in production. As agents rely on MCP to reach tools and data, the tool-call boundary becomes one of the most important places to instrument.
Why tool calls need their own telemetry
The Model Context Protocol is based on JSON-RPC and gives AI applications a uniform way to reach external tools and data. Generic HTTP or RPC instrumentation records that a request happened, but it does not record which tool was invoked or what the agent was trying to do. A single HTTP exchange can also carry several MCP requests, which generic HTTP spans do not describe well. OpenTelemetry’s conventions for MCP therefore recommend following the MCP-specific conventions instead of the generic RPC conventions, because MCP spans record details that RPC spans cannot.
Three questions MCP observability must answer
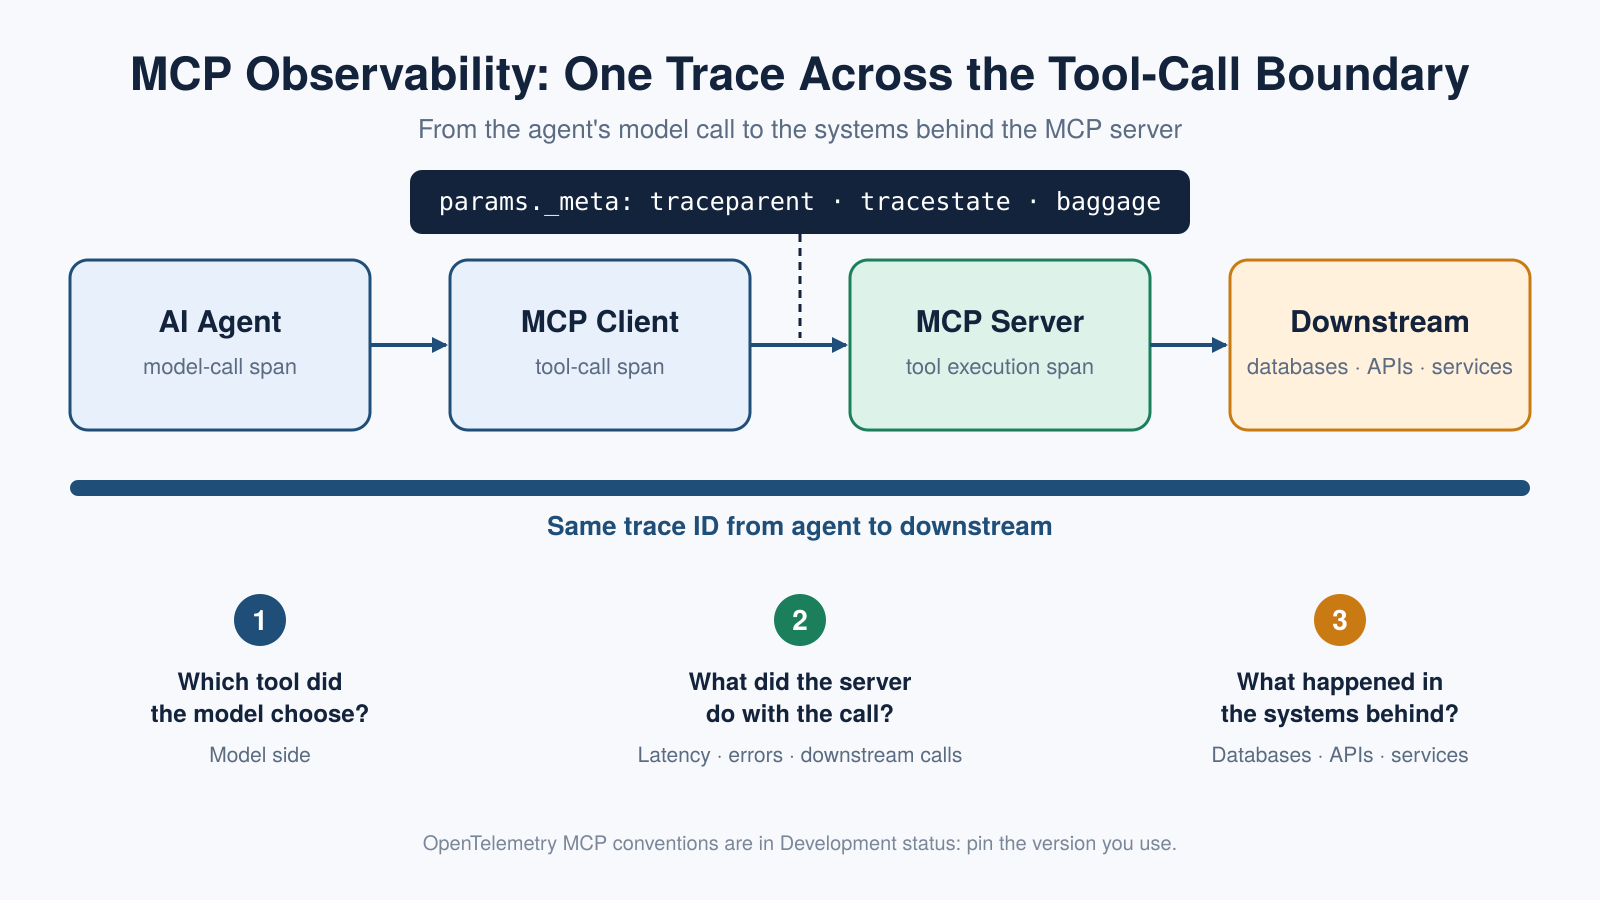
1. Which tool did the model choose, and why? This lives on the model side, in the agent’s model-call spans.
2. What did the MCP server do with the call? This is server-side: latency, errors, and the downstream calls it made.
3. What happened in the systems behind the server? Databases, APIs and other services that the tool depends on.
A useful setup connects all three in one trace.
How trace context crosses the protocol boundary
MCP does not define its own mechanism for propagating trace context. OpenTelemetry’s MCP conventions define how trace context can be propagated through the MCP request’s params._meta property bag. This context may include traceparent, tracestate and baggage, allowing the MCP server span to be linked to the originating client span. Tool call execution spans are designed to be compatible with the general tool-execution spans used for agents.
One caution applies: these conventions are still marked as being in Development status, so span and attribute names can change between releases. Pin the version you use and plan for updates.
What to monitor
● Tool call latency and error rate, broken down by tool and by server
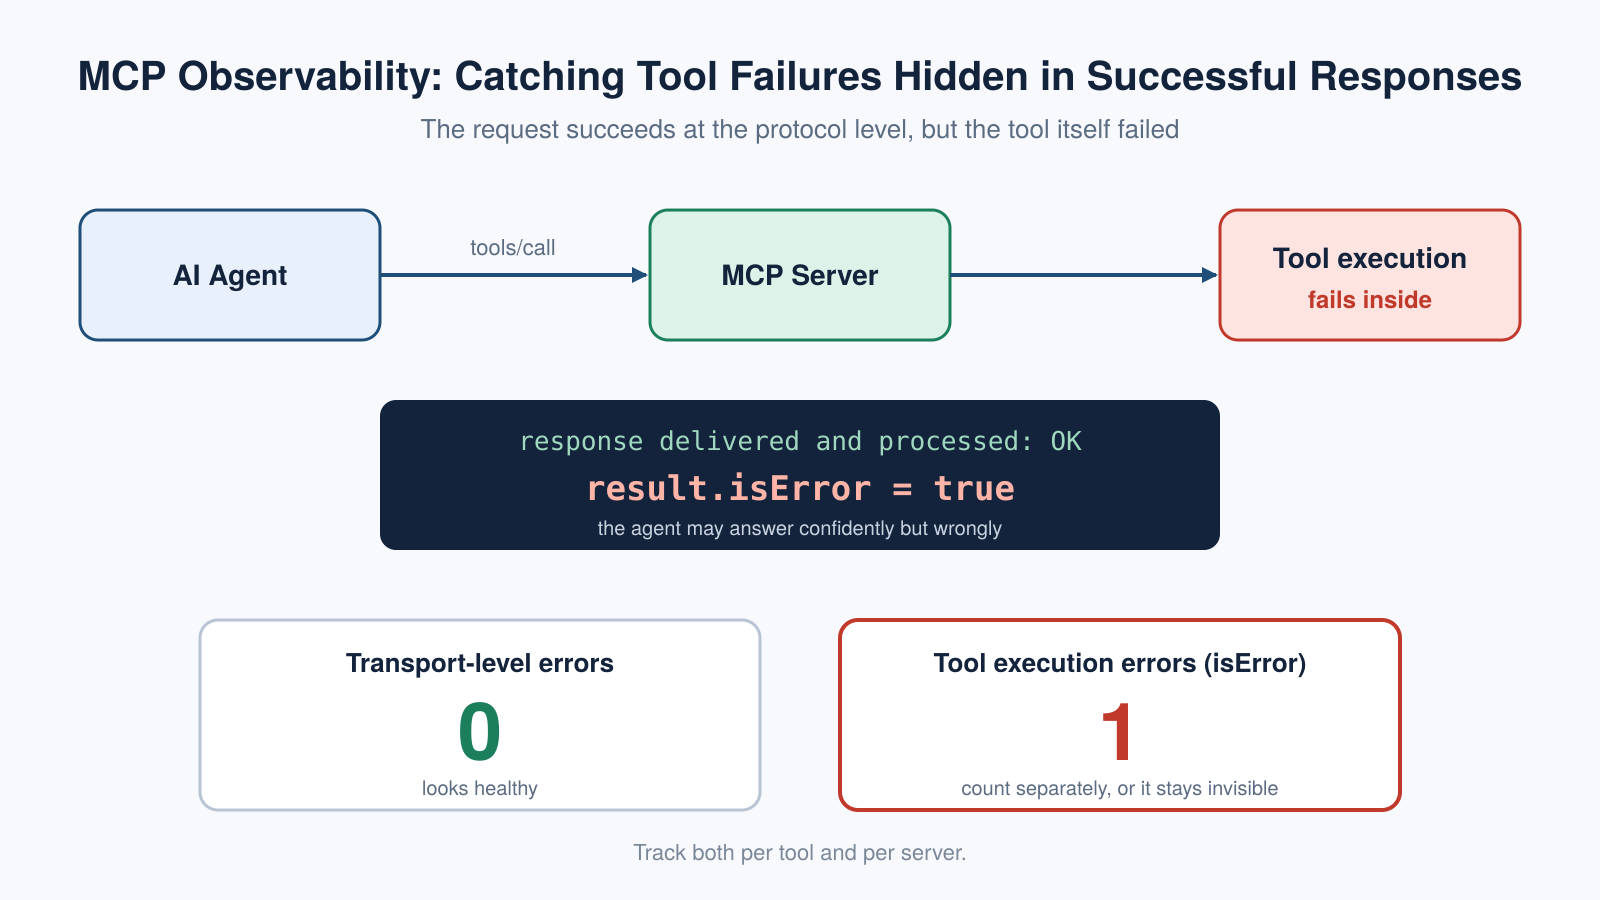
● Tool errors returned inside successful responses. An MCP tool can report an execution failure through the isError field in its result, even when the request itself was successfully transmitted and processed at the protocol level. Count these separately from transport-level errors, or real execution failures will be invisible in transport-level metrics.
● Protocol and session details, such as the protocol version in use and the session a call belongs to
● Argument and result sizes, which affect cost and context usage
● Authentication and permission failures, which often show up as repeated denied calls
● Downstream dependencies of each tool, correlated to the same trace
Common failure modes
Symptom | Likely cause | What to inspect |
Agent answers confidently but wrongly | Tool returned an error flag that was ignored | isError field in each tool result |
Runs become slow | One MCP server or its downstream is slow | Latency per tool and downstream span |
Repeated identical calls | Agent loop after an unhelpful tool result | Call count per run, arguments |
Sudden cost increase | Large tool results inflating context | Result size and input tokens per step |
Calls denied | Permission or authentication change | Auth failures by tool and identity |
Governance belongs in the same telemetry
Because MCP tools can read data and change systems, the same telemetry should record which identity called which tool, with what approval, and with what outcome. Treat arguments as potentially sensitive and mask them according to policy before they are stored.
A short checklist
● Every MCP call produces a span with the tool name and outcome
● Trace context is propagated from the agent through the client to the server
● Tool errors in successful responses, indicated by isError, are counted separately from transport-level errors
● Latency is tracked per tool, per server and per downstream
● Arguments and results are masked according to policy
● Instrumentation versions are pinned and reviewed on a schedule
How this relates to Bonree ONE
Bonree ONE provides an integrated approach to AI observability and agent operations. Through AI Studio, enterprises can manage models, Agents, Skills, MCP tools and knowledge bases in a unified workspace. Sage AI serves as the unified natural-language interaction entry point, enabling users to interact with these resources for operational Q&A, analysis, diagnosis and task execution.
Agents can invoke MCP tools and Skills to access operational capabilities and perform tasks. Combined with Bonree ONE AI Observability and its application and infrastructure monitoring capabilities, teams can gain visibility into agent workflows and examine tool-call issues alongside the services and infrastructure behind them.
FAQ
What is MCP observability?
It is the practice of tracing and measuring Model Context Protocol tool calls, including the tool invoked, the context passed, latency, errors and downstream effects.
If I already trace HTTP requests, do I still need MCP-specific monitoring?
Yes. HTTP spans do not capture which tool was called, and one HTTP exchange can carry multiple MCP requests.
How does trace context pass between an agent and an MCP server?
OpenTelemetry’s MCP conventions define how trace context is propagated through the MCP request’s params._meta property bag, including fields such as traceparent, tracestate and baggage. This allows the server span to be linked to the originating trace.
How do I detect failed tool calls?
Check the isError field in each tool result and count execution errors separately from transport-level errors.
Are the OpenTelemetry conventions for MCP stable?
They are marked as being in Development status, so names may change. Pin versions and review changes regularly.