



As digital transformation deepens across Southeast Asia’s financial industry, mobile banking, instant payments, and other online services keep expanding, and financial businesses depend more heavily than ever on their underlying IT systems. A single customer action often spans the front end, back end, databases, and third-party payment services. The customer experience no longer depends on the health of any one system, but on how the entire technology chain performs together. The challenge for financial institutions has shifted from keeping infrastructure stable to gaining full visibility into business operations, detecting anomalies across systems and services in time, and linking customer experience to underlying technical performance. This places higher demands on end-to-end observability.
In response, on November 18, Ivan Sim, Senior Sales Engineer at Bonree, delivered the second session of the Observability in Practice for Southeast Asia’s Financial Industry webinar series, titled “Systems Show No Alerts, Yet Users Are Leaving: How to Monitor Critical Business Journeys.” Focusing on three critical journeys (mobile banking login, fund transfer, and account inquiry), and drawing on Southeast Asian financial industry cases and a Bonree ONE platform demo, he showed how to start from the customer experience, detect business anomalies, and correlate them with technical root causes.
Rethinking Business Anomalies: Why Can’t Customers Complete Transactions When Systems Look Healthy?
Completing a banking transaction usually requires front-end applications, back-end services, databases, and third-party services to work together. Traditional monitoring focuses on the status of individual components. Even when server and API metrics look normal, that does not mean customers can complete their transactions. For example, an API may return success while the transfer actually fails, a third-party SMS or payment gateway may malfunction without triggering any alert in the bank’s own systems, or an API may respond but take so long that it disrupts the customer’s operation.
Anomalies like these are hard to catch through component-level monitoring alone. Because data from networks, applications, databases, and third-party services sits in different tools with no unified correlation, troubleshooting becomes even harder. Financial institutions therefore need to extend their monitoring perspective from individual technical components to the full customer business journey, tracking not only whether systems are running, but also whether customers can complete their transactions.
Focus on Critical Journeys: Building Business Observability from the Customer Experience
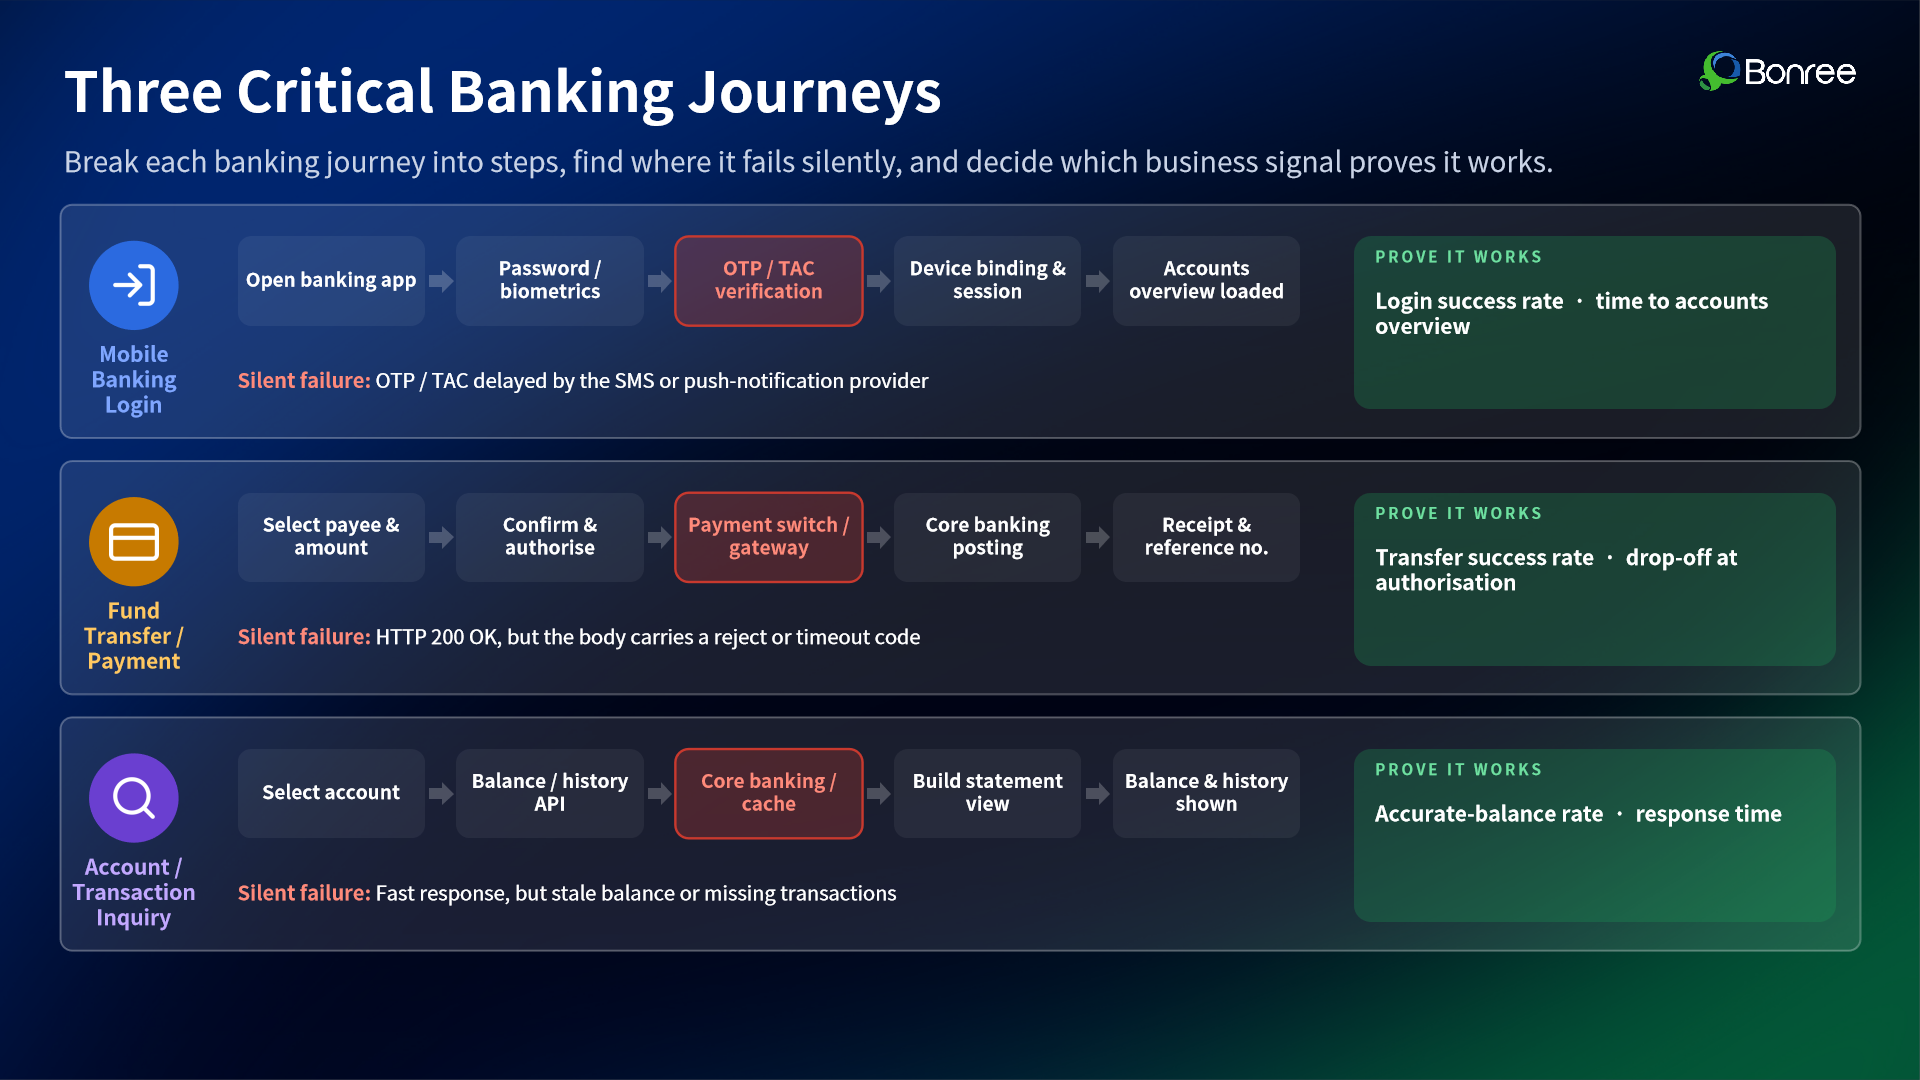
For banks, login, transfer, and account inquiry are the most fundamental and critical journeys. Ivan outlined the key business indicators to watch in each scenario:
Login journey: login success rate, SMS verification code delays, and authentication failures.
Transfer journey: transfer success rate and drop-off at the authorization step, plus anomalies where the API returns success but the transaction is actually rejected or times out.
Account inquiry journey: balance accuracy, avoiding cases where the page responds normally but displays outdated data.
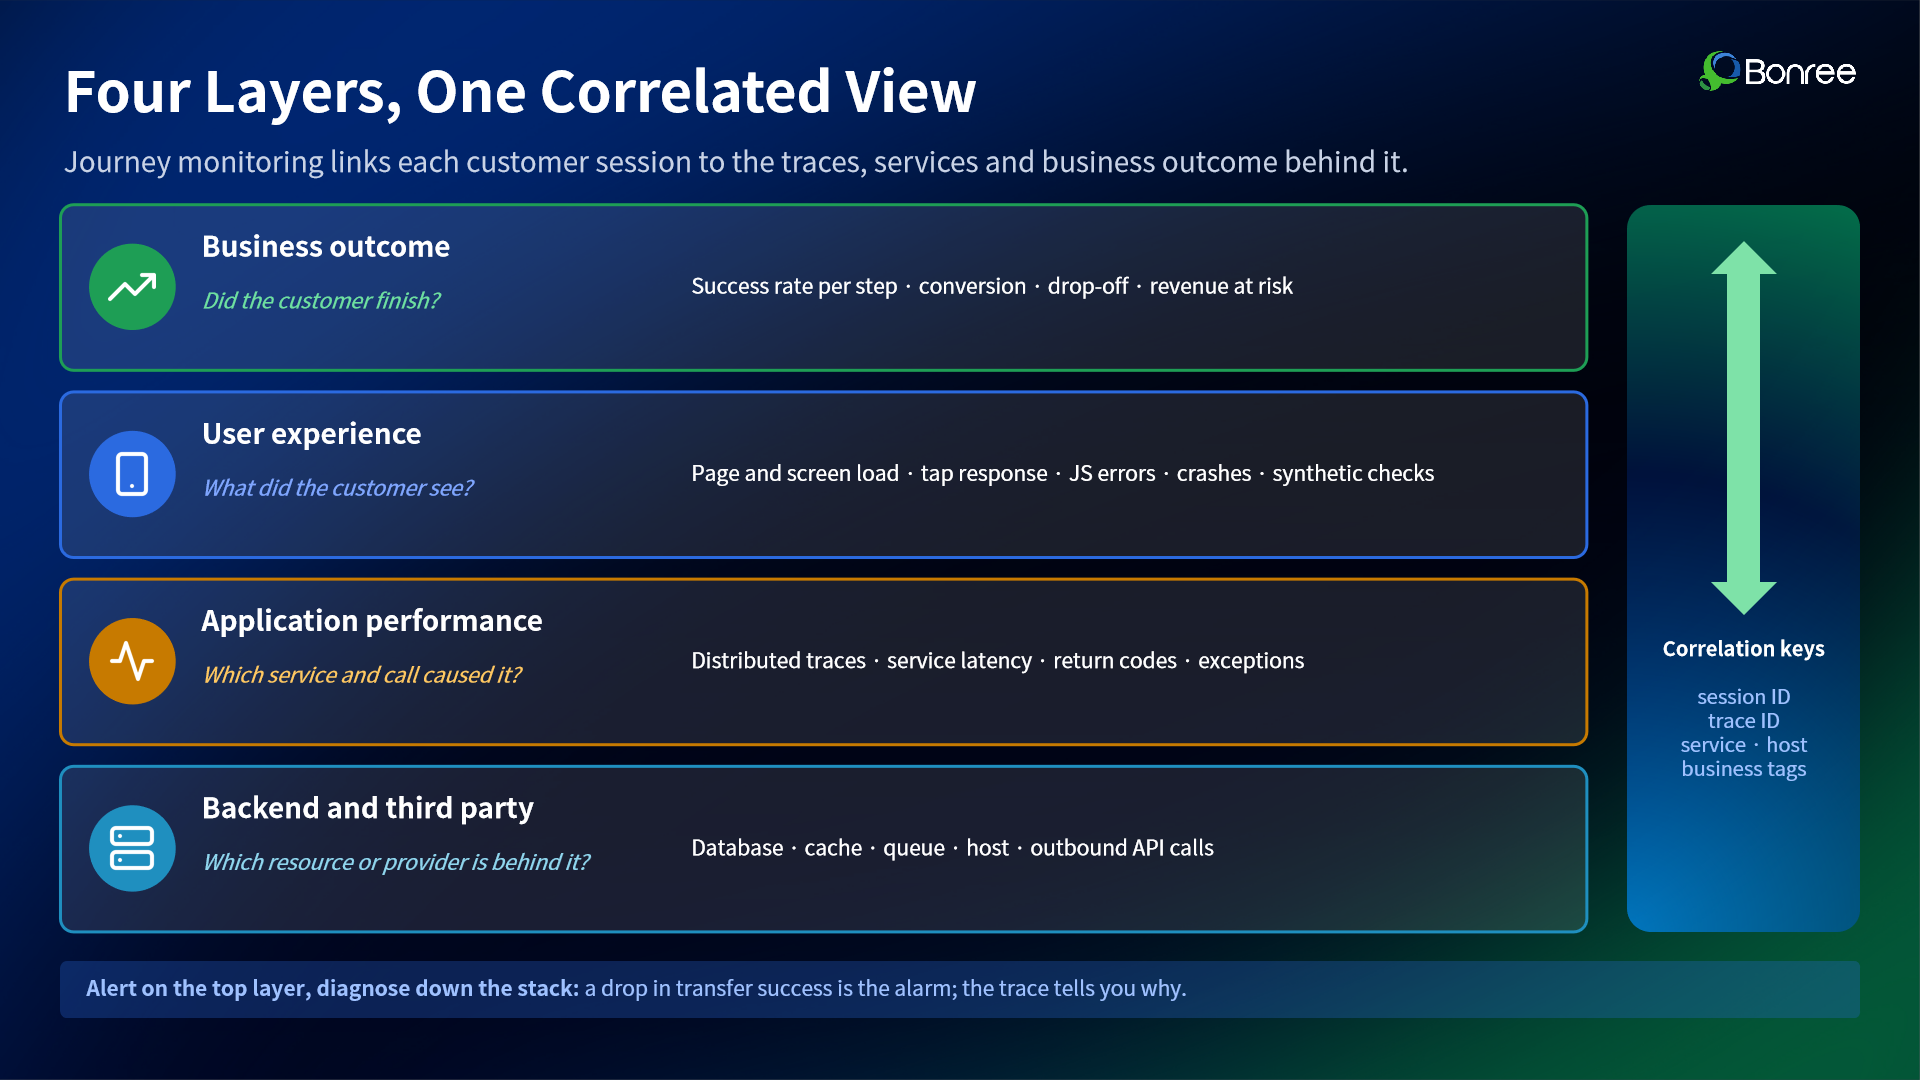
To truly see a business journey, customer actions must be linked to underlying technical data. By collecting real user actions, application traces, database and cache status, and third-party service responses, and connecting them through session IDs and Trace IDs, technical teams can follow a single customer action step by step down to the specific technical node.
On the Bonree ONE platform, correlating real user behavior with back-end application performance data connects customer actions, business performance, and underlying technical calls. This helps technical teams start from business outcomes and analyze where an anomaly occurred and how far its impact extends.
Beyond real user behavior, teams can also proactively validate critical journeys through scheduled synthetic logins and test transfers, catching problems that might otherwise go unnoticed during low-traffic periods.
Detecting anomalies from business outcomes and tracing technical causes along the full call chain is the key to moving operations from reactive response to proactive detection.
Case Review: Detecting and Handling a Transfer Failure During a Promotion
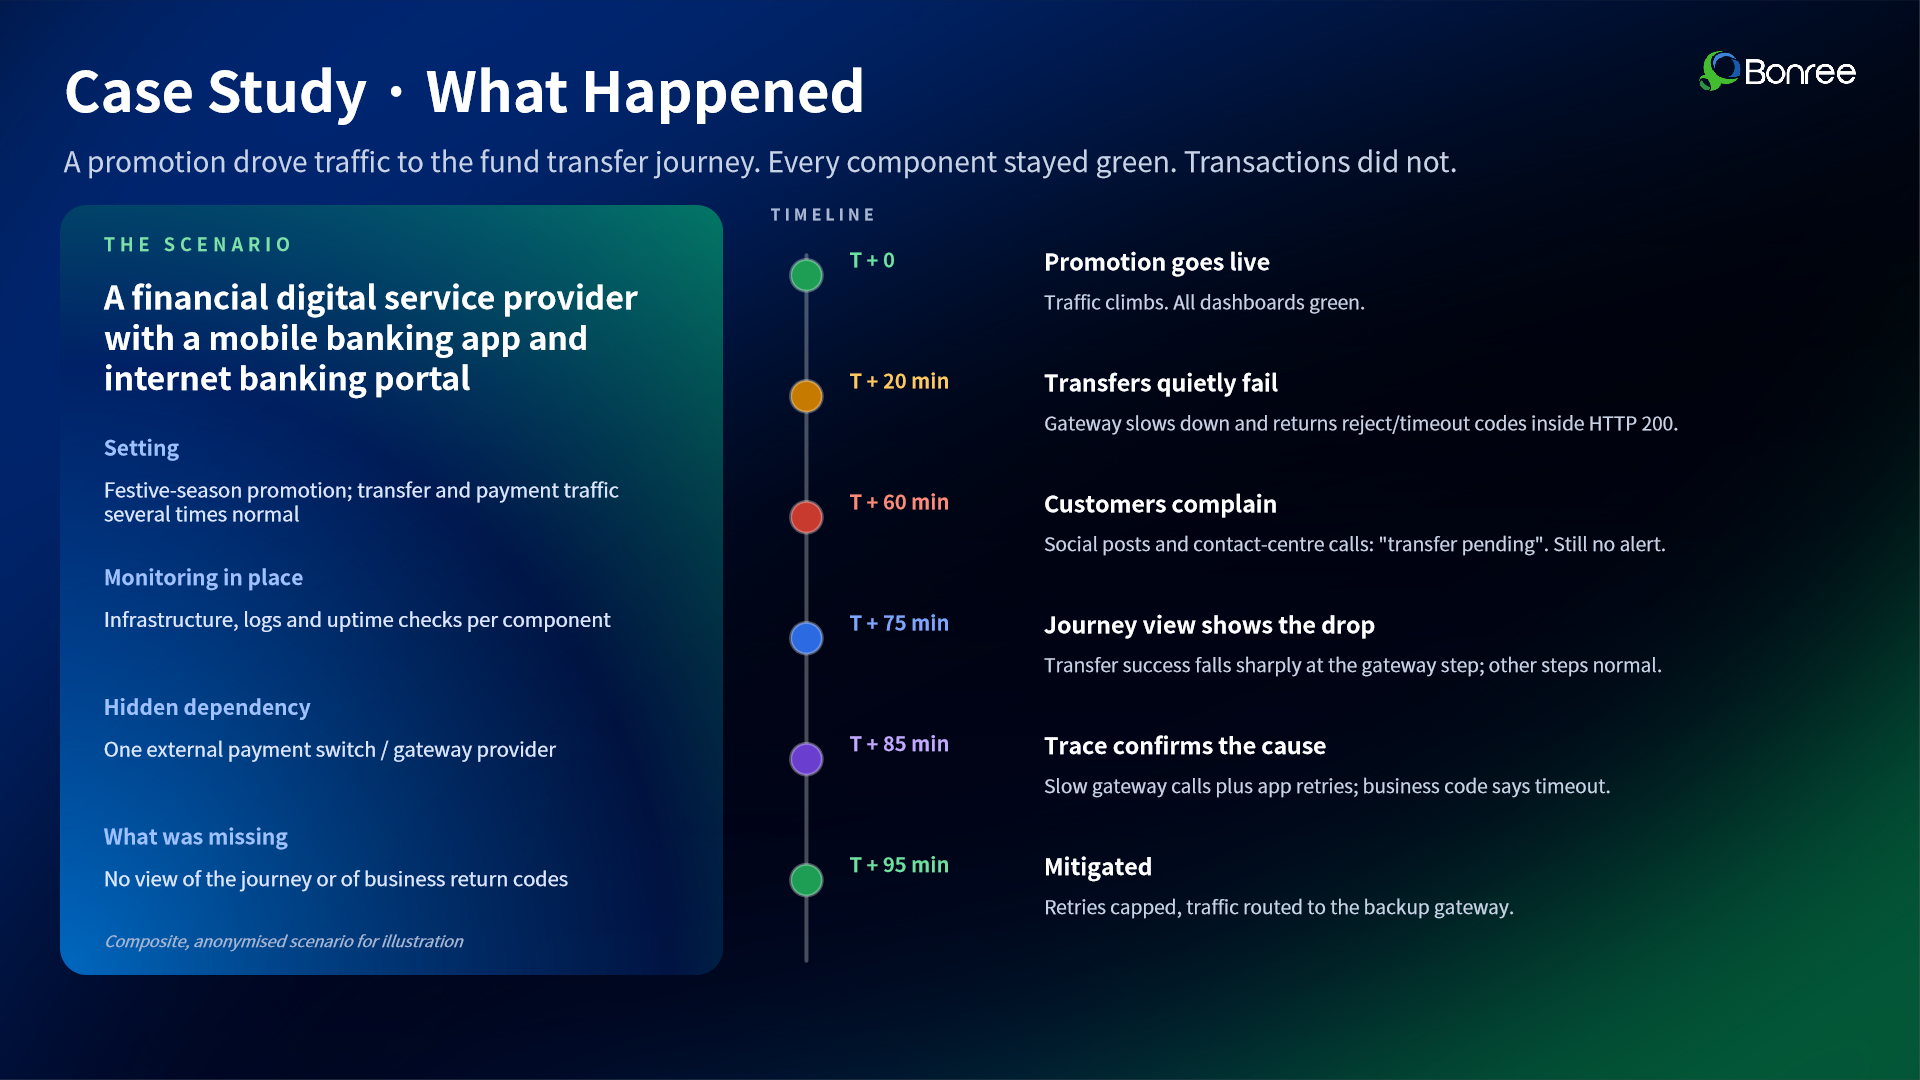
Ivan shared a typical case from a Southeast Asian customer. During a festive promotion, the customer’s transfer and payment traffic surged to several times its normal level. About 20 minutes after the promotion went live, the external payment gateway began responding slowly and returning business status codes such as rejection and timeout, causing some transfers to fail. However, because infrastructure and component availability metrics remained normal, no alert was triggered.
It was not until minute 75, when customers reported through social media and the call center that transfers were stuck on “Processing,” that the team noticed the problem. By then, business journey data already showed a clear drop in the transfer success rate at the payment gateway step, while other journeys such as login and account inquiry remained normal. Traces then confirmed that the anomaly was concentrated at the payment gateway. The team ultimately limited the app’s retry behavior and switched transfer traffic to a backup gateway.
The failure went unnoticed for 55 minutes. This shows that relying solely on infrastructure and component monitoring makes it hard to detect business anomalies in time. Teams need to start from actual customer actions and link business performance with underlying technical data.
For scenarios like this, Bonree ONE uses real user experience monitoring, end-to-end tracing, and intelligent root cause analysis to help technical teams reconstruct business failures and locate the problem.
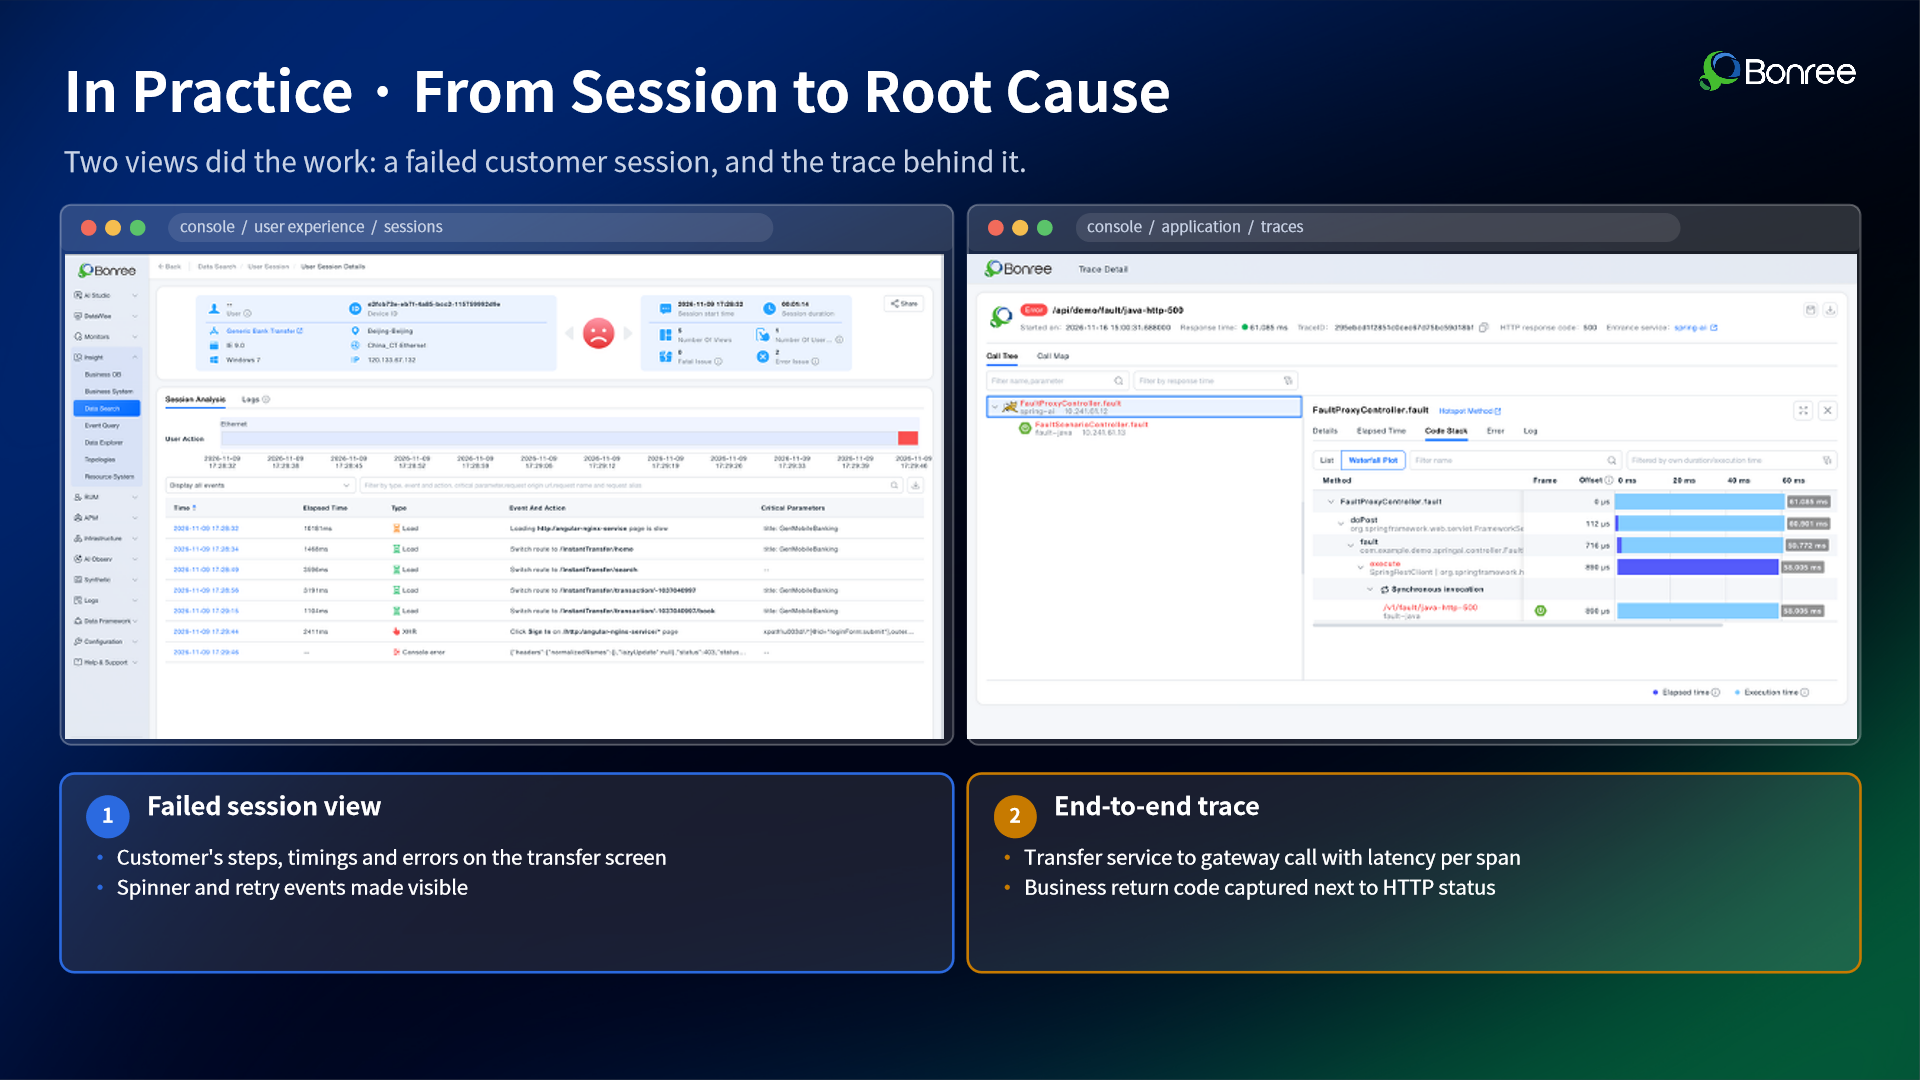
Reconstruct the failure from customer sessions.
With Bonree ONE’s customer sessions, teams can view the steps, execution times, and error details of a failed transfer, turning customer experience problems such as a page that keeps spinning or repeated attempts into a traceable sequence of actions. Teams can then open the corresponding end-to-end trace and follow the request layer by layer from the transfer service to the payment gateway, analyzing call relationships and latency at each step. By combining business return codes with HTTP status, they can identify cases where the API status is normal but the business processing actually failed, and quickly narrow the scope of investigation.
Analyze root causes with service topology and Smart Ask.
In a separate demo simulating an online securities trading application, Ivan showed how Bonree ONE combines service topology, traces, and Smart Ask for fault analysis.
When an application component becomes abnormal, the service topology shows the affected component and its upstream and downstream dependencies. Combined with component error information, response times, and trace waterfall charts, the team can further identify the faulty link. In the demo, the reverse proxy showed delayed responses along with HTTP 500 errors.
Smart Ask was then used to launch an intelligent analysis. The system analyzed and reasoned around the abnormal service and ultimately traced the problem to a slow HTTP call in the pricing service. It then generated a root cause analysis report covering the root cause conclusion, fault propagation path, key trace IDs, affected scope, and recommended actions, which can be exported as Word or PDF.
From customer session reconstruction and trace analysis to AI-assisted root cause analysis, Bonree ONE connects business experience with technical data, helping teams identify and locate problems more clearly and efficiently.
For financial institutions, critical journey observability is more than an expansion of technical data collection. It is a shift from a technical-component perspective to a business-outcome perspective. In practice, institutions can start with one critical journey, such as login or transfer, and bring success rate, response time, and business return codes (such as declined, insufficient funds, and timeout) into the analysis, gradually building an observability system that runs from detecting business anomalies to locating technical root causes.
Scan the QR code to download the speaker’s slides.