


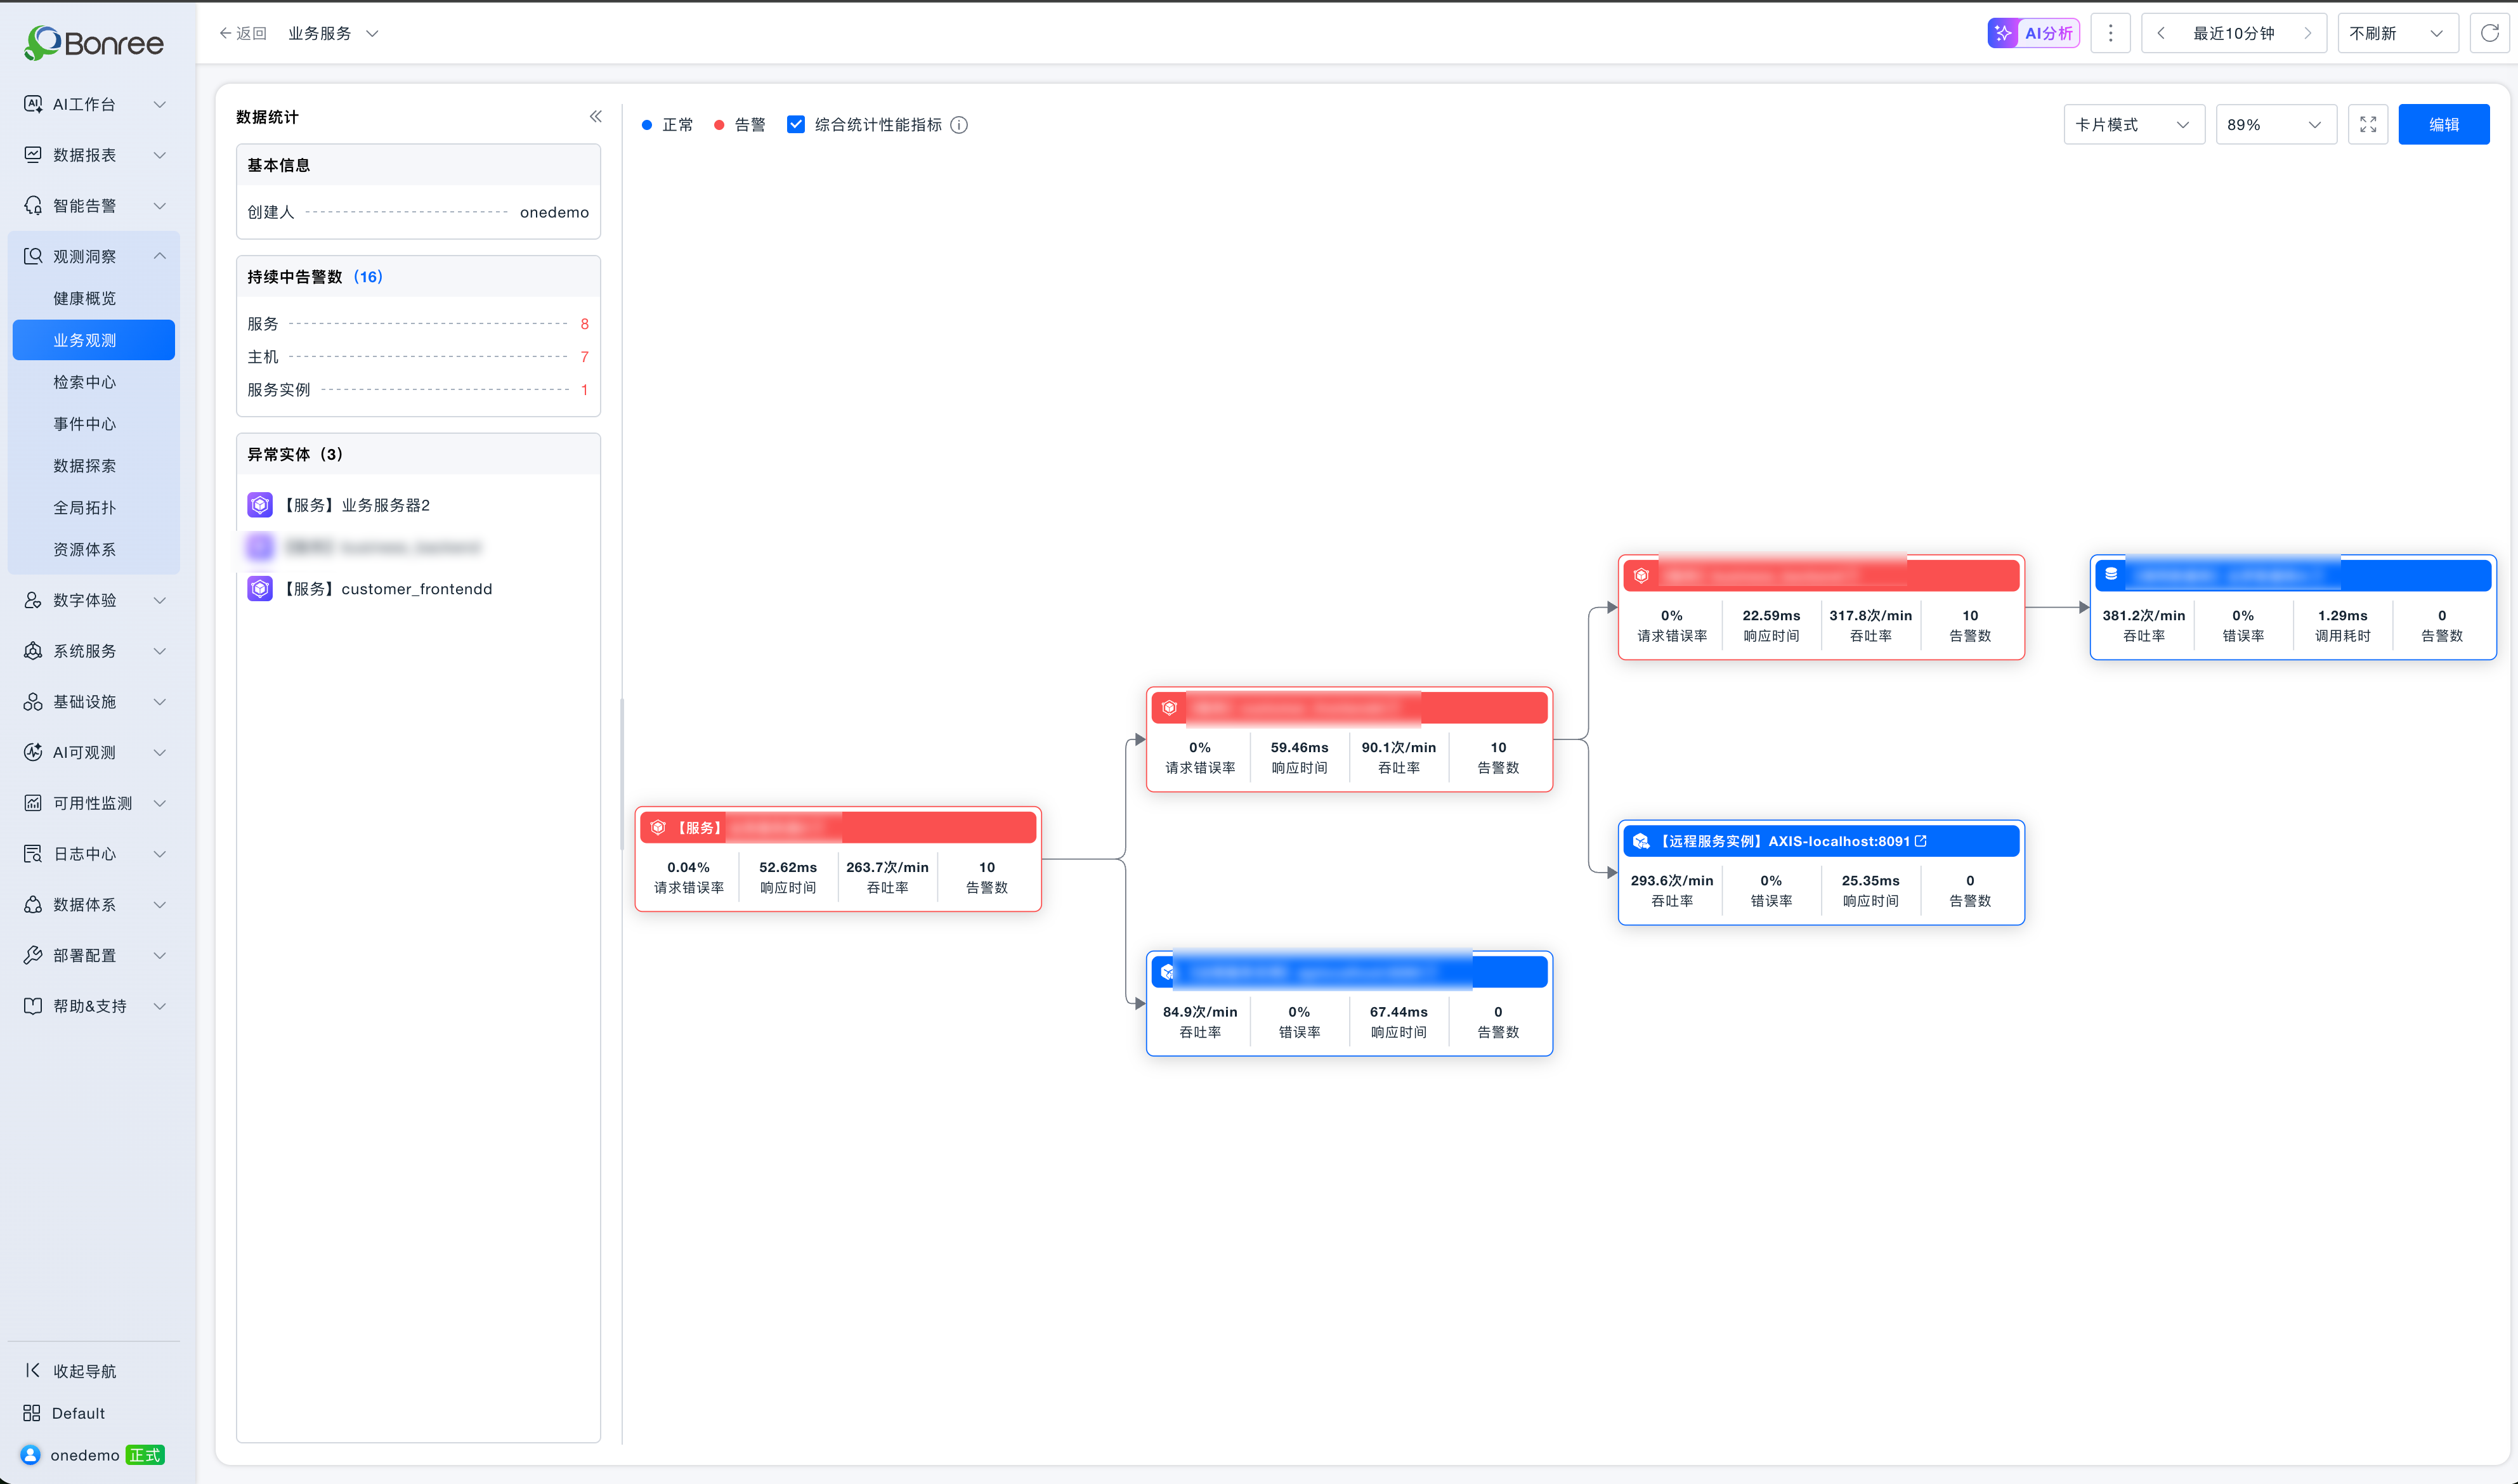
This is a real service dependency chain (Chain ID: 1611). The entry node, “Business Server 2,” calls customer_frontendd and business_backend, then goes through an RPC remote service, and finally reaches Dameng Database A. On the topology map, three service nodes are all marked in red, with 16 ongoing alerts. However, the overall service availability remains stable—error rate is nearly zero, response times are in the tens of milliseconds, and Apdex is close to 0.99. So where exactly is the problem, and does it even need intervention?
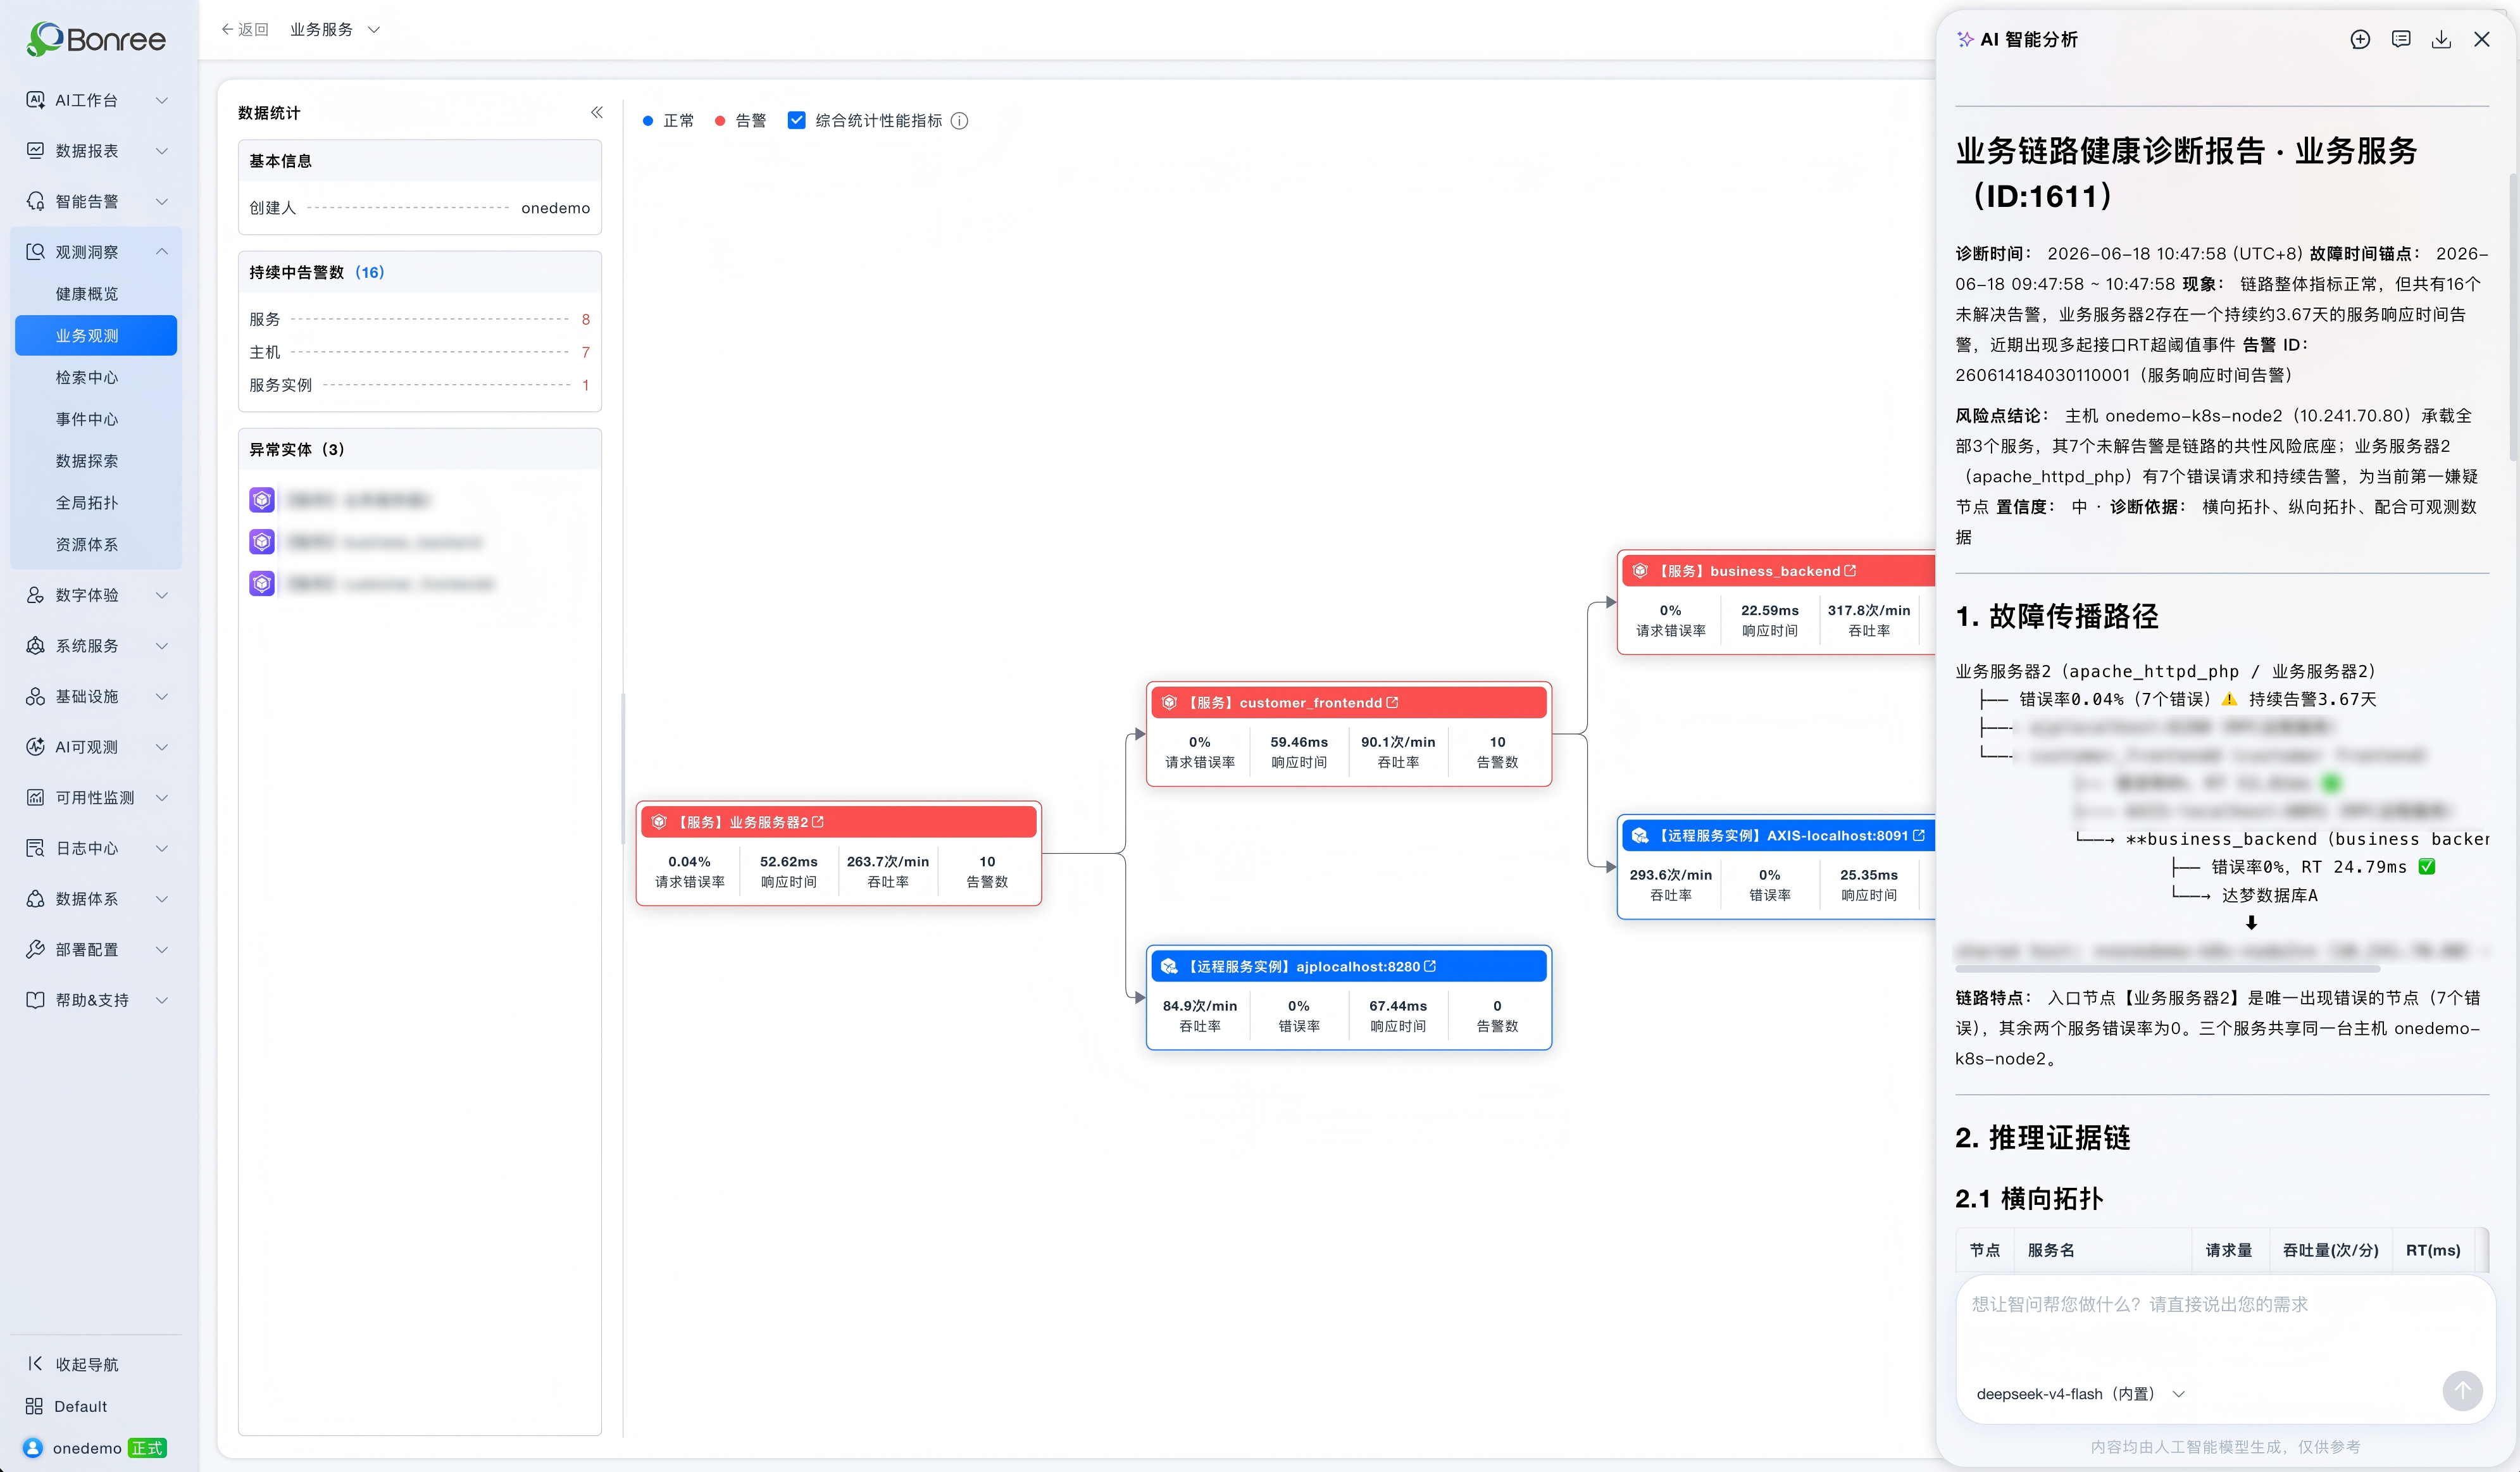
In the past, SREs would need to constantly switch between topology views, metrics, logs, alerts, and change records, investigating each layer one by one. Now, with a single click on “AI Analysis,” Bonree ONE’s Sage AI directly identifies the risk points.
Health Analysis: Narrowing Down Suspicious Areas Through Call Relationships
Sage AI does not rely on a single metric. Instead, it reasons about the entire service chain as a whole.
It first analyzes the horizontal topology. The entry service, “Business Server 2,” has 7 failed requests (error rate 0.04%), while downstream services customer_frontendd and business_backend both show zero errors. This indicates that the errors originate from the entry node itself rather than being propagated from downstream services. The AI therefore stops further downstream traversal and directly isolates Business Server 2 as the suspected source, eliminating the need to investigate each service along the chain.
It then performs vertical topology analysis and uncovers a subtle but critical risk: the core instances of all three services are deployed on the same host, onedemo-k8s-node2, which already has 7 unresolved alerts. This represents a cluster-level single point of failure rather than an isolated service issue.
By correlating observability data (USE/RED metrics + logs + alerts), the AI further confirms that there are no error-level logs within the past hour. All 20 detection events are minor response time fluctuations slightly exceeding a 10ms threshold, repeatedly recovering automatically. Based on this, the AI determines these are alert noise caused by overly sensitive thresholds rather than a true performance degradation.
Change Analysis: Eliminating “Did Something Change Recently?”
Health analysis is only part of the story.
Sage AI also performs change correlation analysis, reviewing deployments, configuration changes, and scaling events within the past hour. The result shows no external changes—only system-generated monitoring events.
This step is crucial: it rules out the possibility that a recent release or configuration change caused the issue, classifying the anomaly as a runtime, chronic condition rather than a change-induced incident. This helps SRE teams avoid unnecessary investigation paths.
Within minutes, Sage AI transforms this service map into an actionable diagnosis:
Root causes: 7 failed requests from Business Server 2 + shared-host single-point risk across three services
Impact scope: Entire 1611 service chain and host-level risk exposure
Prioritized actions:
P0: Identify the source of the 7 failed requests and investigate 7 host-level alerts
P1: Evaluate whether the response time alert (persisting for 3.67 days) is caused by an overly sensitive threshold
P2: Review RT thresholds and service decomposition strategy
What previously required SREs to jump across multiple dashboards is now reduced to a single click. The service map is no longer just something to observe—it becomes something that AI can understand and turn into answers.