



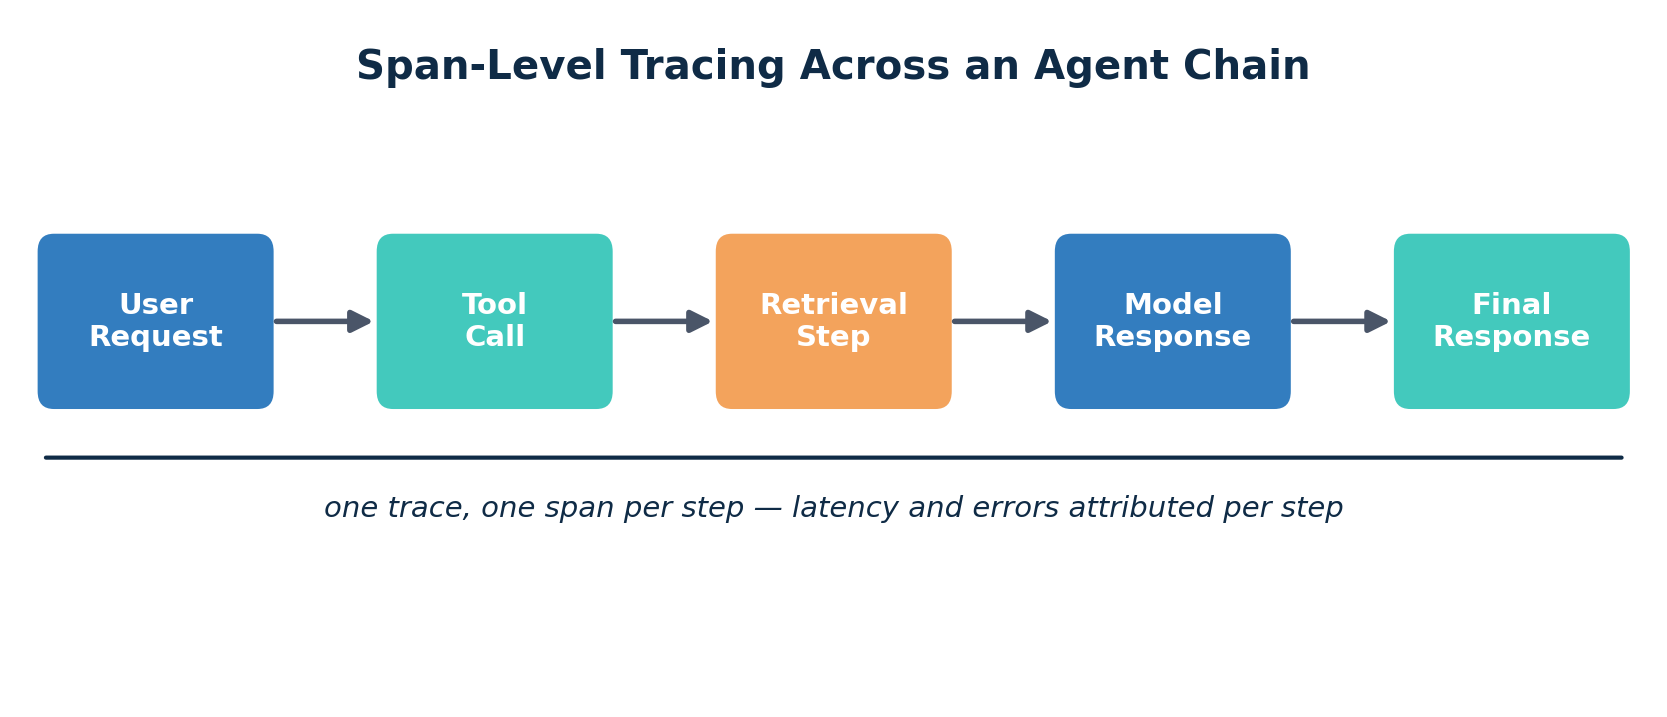
What does it actually take to build AI Observability into an LLM-backed application? More than wrapping a single API call in a timer. A modern AI application is rarely one prompt and one response — it's a chain: a user request, a tool call, a retrieval step, maybe a hand-off to a second agent, and finally a model response. AI Observability has to follow that whole chain, not just the endpoint that happens to sit in front of it — which is the core idea behind Bonree ONE's AI Observability capability.
Why Span-Level Tracing Matters More Than Endpoint Monitoring
A single "LLM call succeeded" metric hides much of what matters when something goes wrong: which step in the chain added the extra latency, which tool call returned malformed data that the model then had to work around, or which retrieval step returned an empty context that led to a low-quality answer. Span-level analysis breaks the chain into its component steps and preserves the input/output at each one, so an investigation can trace where a slow or wrong response likely originated instead of guessing from an aggregate number.
Bonree ONE's AI Observability capability, expanded in its 4.0 release, is built around this: end-to-end tracing and span-level analysis across apps, agents, models, chains, tools, and tasks, with trace waterfalls that reconstruct execution paths and latency breakdowns to help pinpoint bottlenecks. That level of granularity is what can turn "the agent was slow" into a more specific hypothesis about which step in the chain likely added the latency — a difference that tends to show up once tracing goes below the aggregate-metric level.
Token Cost Doesn't Track Infrastructure Cost — So Don't Monitor It Like Infrastructure
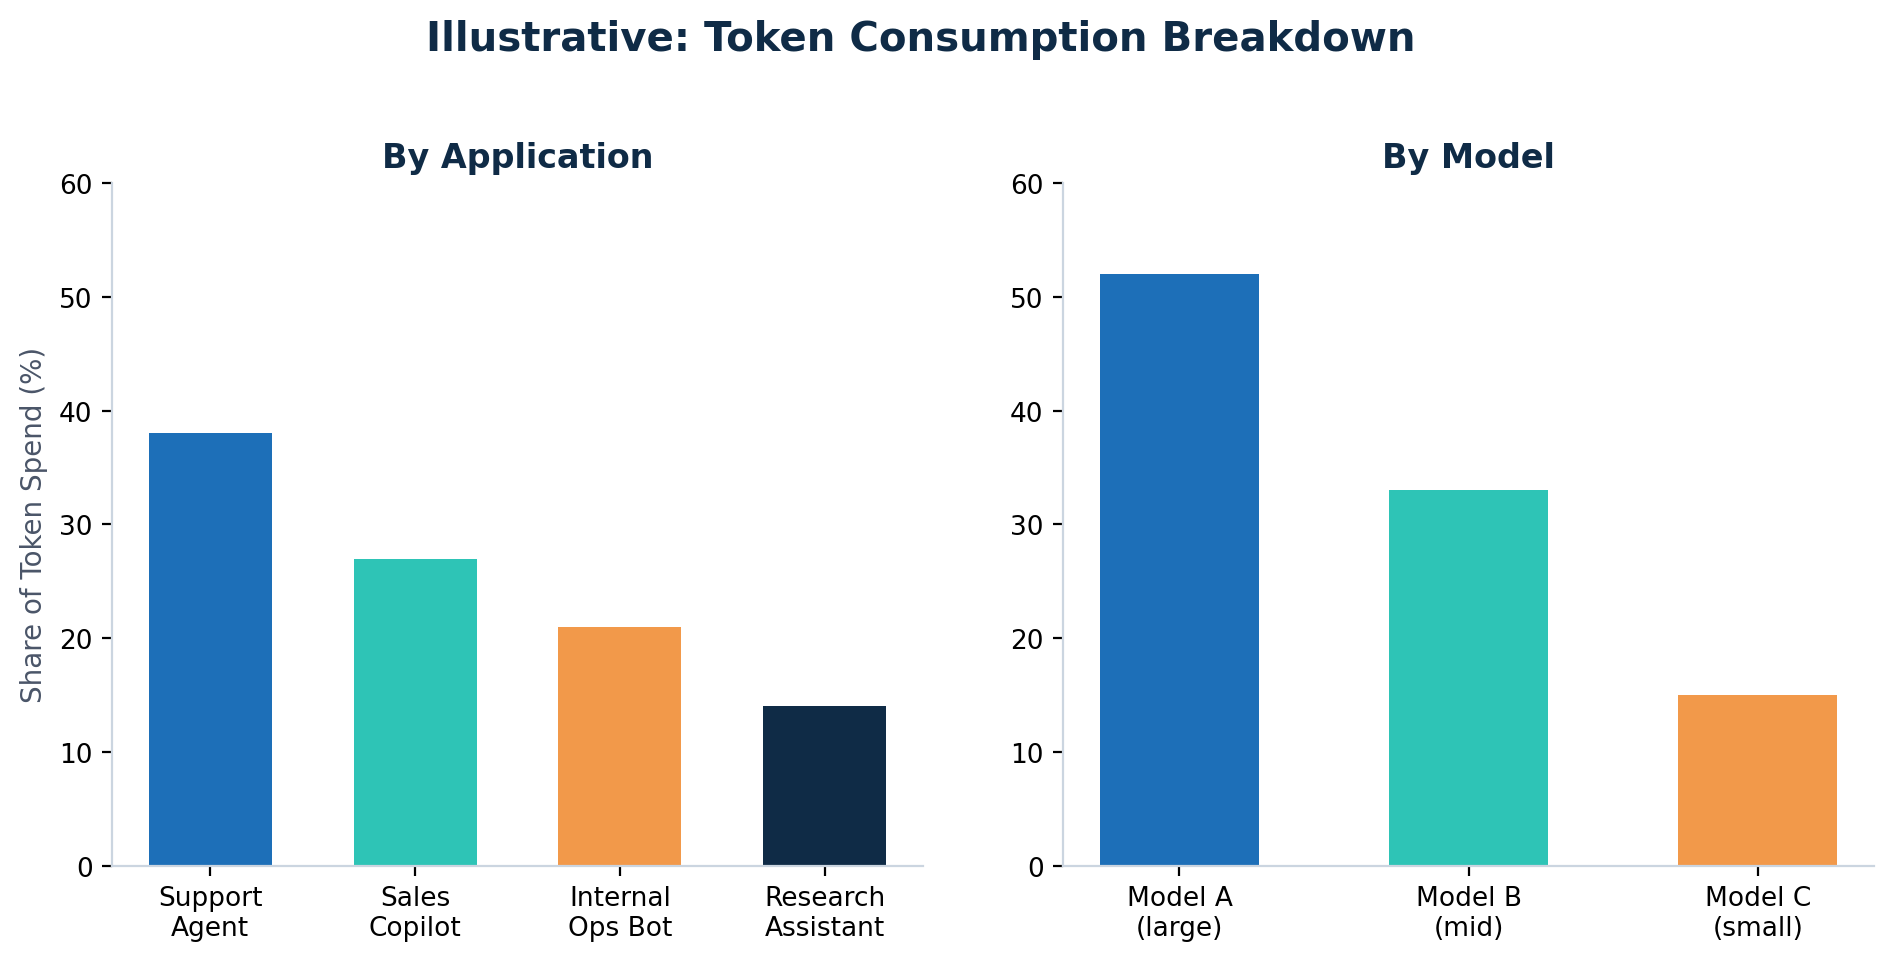
Token consumption is driven by prompt length, context size, and how many steps a chain takes to resolve — not CPU or memory. That means a cost spike can happen with little infrastructure signal to catch it early. Token and cost insight, part of Bonree ONE's AI Observability capability, tracks request volume, latency, error rate, and token consumption per app and per model, so a spike can be attributed to the app or model that caused it rather than discovered later as an unexplained line item.
Framework Support Is Increasingly Important
Agent frameworks like LangChain and LangGraph have become a common way teams build multi-step AI applications, and observability tooling that only understands a raw API call can miss much of what the framework itself orchestrates — the graph of nodes, the conditional routing between them, the shared state passed along the chain. Supporting these frameworks at the tracing layer, rather than only at the model-API layer, is part of what makes session-level context tracking possible: following one user's session through however many tool calls, retries, and agent hand-offs it actually took.
Instrumentation Without the Manual Setup Tax
A common practical failure mode for AI Observability isn't a missing dashboard — it's incomplete instrumentation, because manually wrapping every tool call and chain step in tracing code tends not to hold up against a fast-moving agent codebase. Probe-based, configuration-light instrumentation that captures call telemetry automatically — rather than requiring hand-written tracing calls at every step — helps keep trace data more complete as the application evolves. For teams that also want a conversational, agentic layer on top of this trace data, Bonree ONE•Sage AI can help operators query and reason over these traces in natural language rather than manually assembling dashboards.
FAQ
Is span-level tracing overkill for a simple single-call LLM feature?
For a single, stateless prompt-response feature, aggregate metrics may be enough. Once a feature involves a tool call, a retrieval step, or a hand-off between agents, span-level tracing becomes a much more reliable way to isolate which step actually caused a slow or incorrect response.
Why track token cost per application and per model instead of just a total?
Because a total can mask which app or model is actually responsible for a spike. Per-app, per-model breakdowns turn an opaque invoice line into something a specific team can investigate and act on.
Does AI Observability tooling need to understand LangChain or LangGraph specifically, or is generic API tracing enough?
Generic API-level tracing typically only sees the model call, not the graph structure, conditional routing, or shared state the framework manages around it. Framework-aware tracing makes it more feasible to reconstruct a full agent execution path rather than a series of disconnected model calls.
What's a common instrumentation mistake in AI Observability?
Relying only on manually added tracing code at each step of an agent chain. It can work initially but tends to degrade as the chain is refactored, leaving partial trace coverage exactly when a full trace is needed most — which is why probe-based, low-configuration instrumentation tends to hold up better over time.