






Background: A User Complaint Arrives at 3 PM on Friday
A user complaint was submitted through the ticketing system:
“I clicked ‘Wealth Management’ several times on the settlement page. It kept loading for a long time and never opened…”
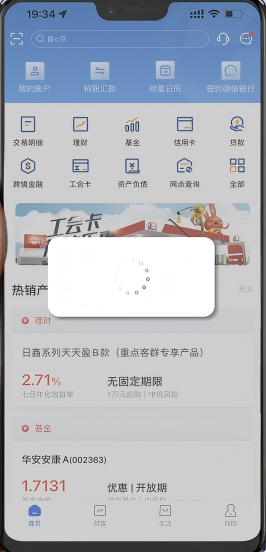
▲ The actual user experience: The page keeps loading after clicking “Wealth Management”
This is a common scenario faced by many internet teams: users encounter problems, but the development team has no visibility into what actually happened. Troubleshooting relies on assumptions, communication becomes inefficient, and reproducing the issue depends on luck.
With Bonree ONE Frontend RUM Observability, this process becomes completely different.
1. How Can Operations Teams Identify the User Scenario Within 5 Minutes?
The Session Replay module in Bonree ONE Frontend RUM Observability works like a “time machine” for operations teams. It fully reconstructs user journeys and transforms frontend issue reproduction from “trial and error” into an instant replay.
After receiving the complaint, the operations team opens the Session Replay module in Bonree ONE and filters the affected user by user ID.
The platform has already recorded every step from page entry to the white screen issue, including page loading, user clicks, loading delays, and frontend errors.
The team can clearly view:
User interaction paths
Page loading performance
JavaScript errors
Performance bottlenecks
Related requests and events
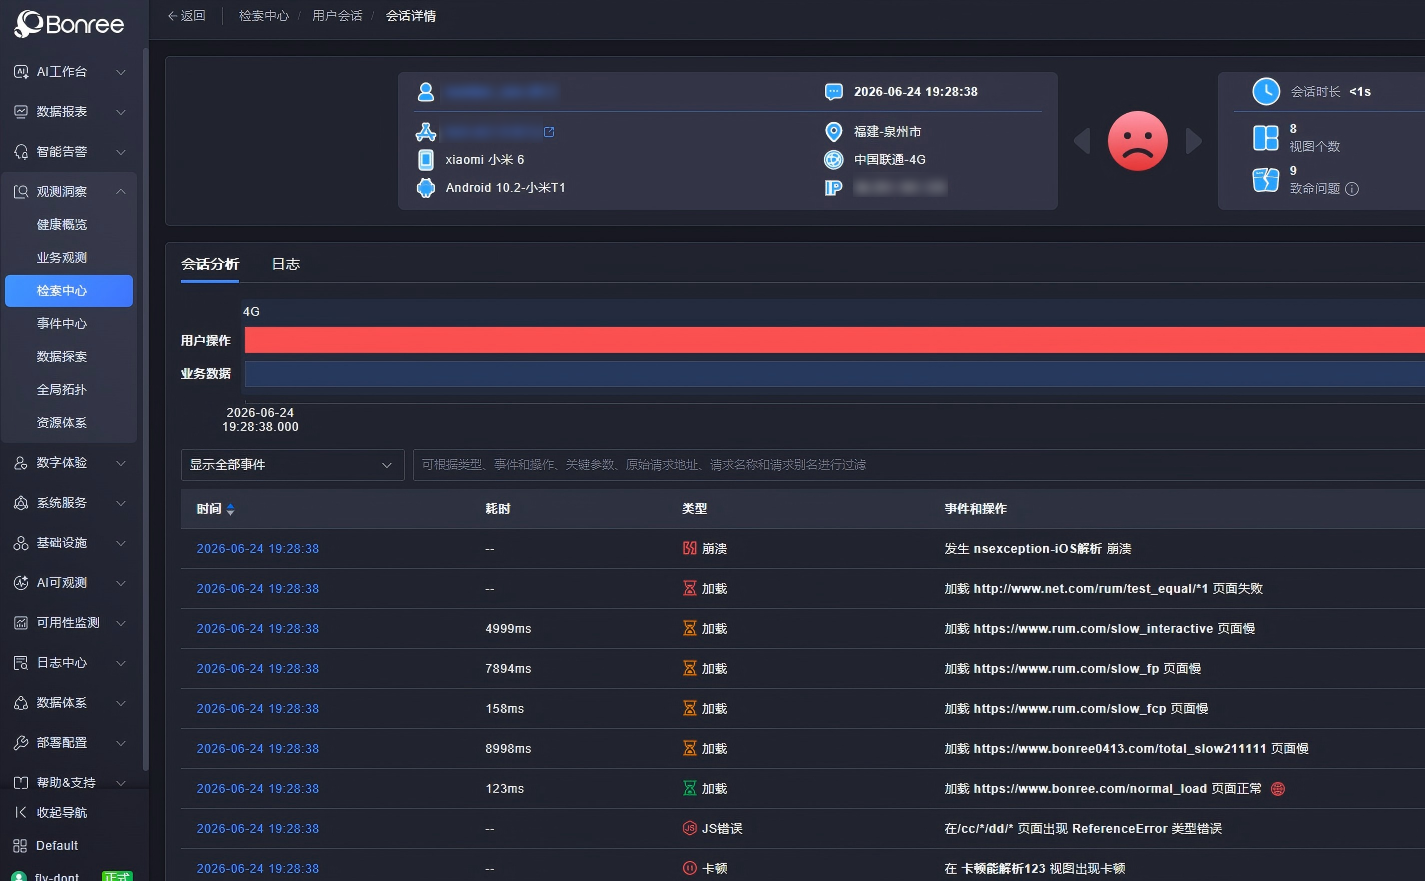
▲ Session details: Fully reconstructs the user journey and identifies the 7,894 ms loading timeout event
By switching to the event list, the team finds the request associated with the problematic operation and obtains the corresponding Trace ID. After opening the trace link, the complete request chain becomes visible, allowing the team to locate the root cause:
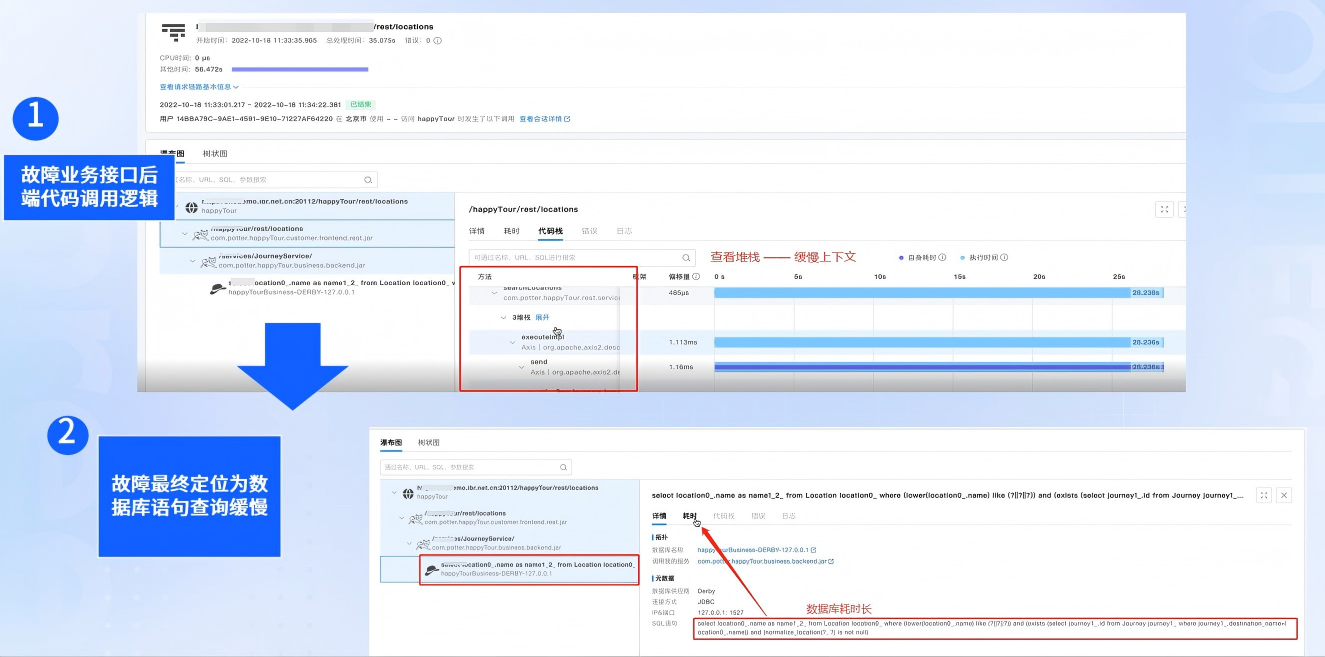
▲ Trace analysis: Backend call chain reveals slow database query execution as the root cause
The operations team shares the session replay link, error screenshot, and Trace ID with developers:
“Here is the replay session and Trace ID. The root cause has been identified as a slow database query. Please take a look.”
From receiving the complaint to reproducing the exact scenario, the entire process takes less than 5 minutes.
No more relying on user descriptions to reproduce frontend issues.
2. How Can Developers Quickly Identify Problems Introduced by New Releases?
The Version Comparison panel in Bonree ONE Frontend RUM Observability acts as a “before-and-after comparison tool” for developers. It compares key performance indicators between different application versions, allowing performance regressions and error increases to be identified within seconds.
The development team has just released the redesigned settlement module version v2.3.1 and is waiting for validation results.
After receiving the operations team’s message, the developer opens the Core Metrics · Version Comparison panel and compares the previous version (v2.3.0) with the current release (v2.3.1).

▲ Version comparison: v2.3.1 improves loading performance, but JavaScript error rate increases from 0.3% to 1.7% (↑467%), while request success rate decreases from 99.1% to 96.8%
The analysis reveals:
Loading performance improved significantly
JS error rate increased from 0.3% to 1.7%, a 467% increase
Request success rate dropped from 99.1% to 96.8%
This confirms that the frontend errors introduced in v2.3.1 are the cause of the user white screen issue.
The developer drills down into the JS error details, reviews the error stack trace, identifies the problematic code, and quickly prepares a fix.
The developer responds:
“Located the issue. The API 500 error handling fallback was missed during the refactoring process. The fix has been completed and will be verified through tomorrow’s gradual rollout. ✅”
3. How Can Operations Teams Understand Impact Scope Through Health Overview?
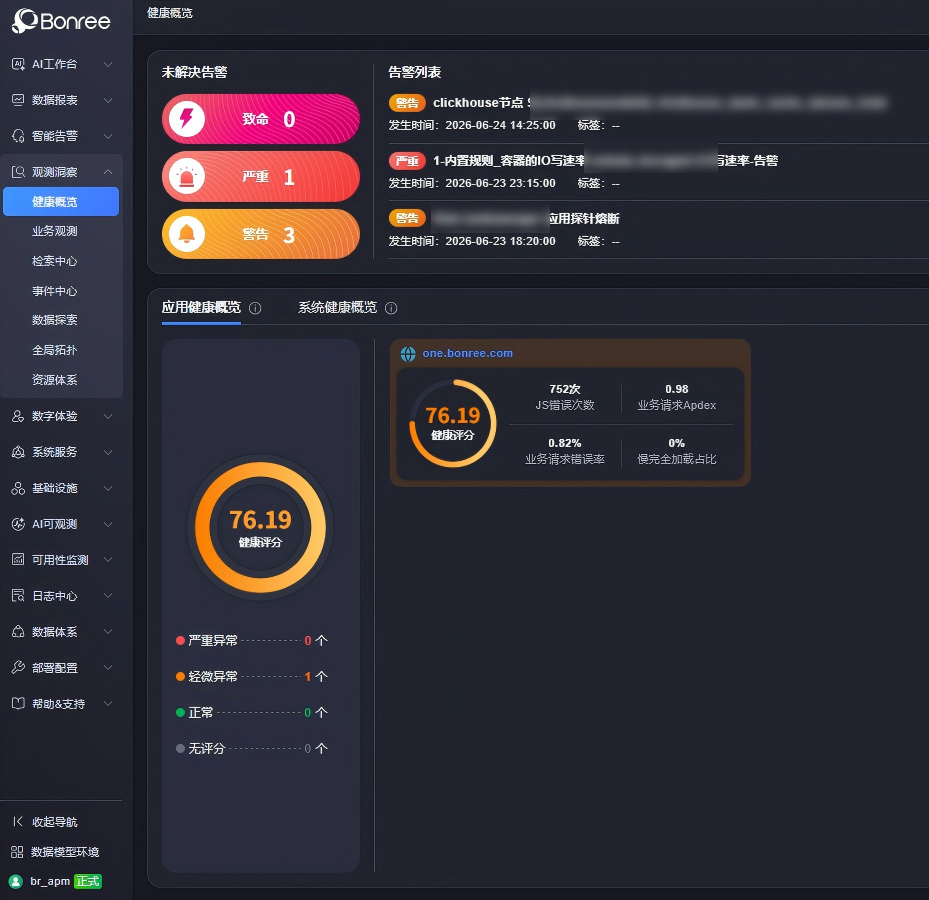
The Health Overview Dashboard in Bonree ONE Frontend RUM Observability provides operations teams with a “global radar.” It aggregates application health scores, error statistics, and geographic distribution into a single view, allowing teams to understand impact scope without waiting for developer feedback.
The operations engineer opens the dashboard monitored daily and discovers that one application has a health score of 76.19, indicating an abnormal status. The number of JavaScript errors reaches 752.
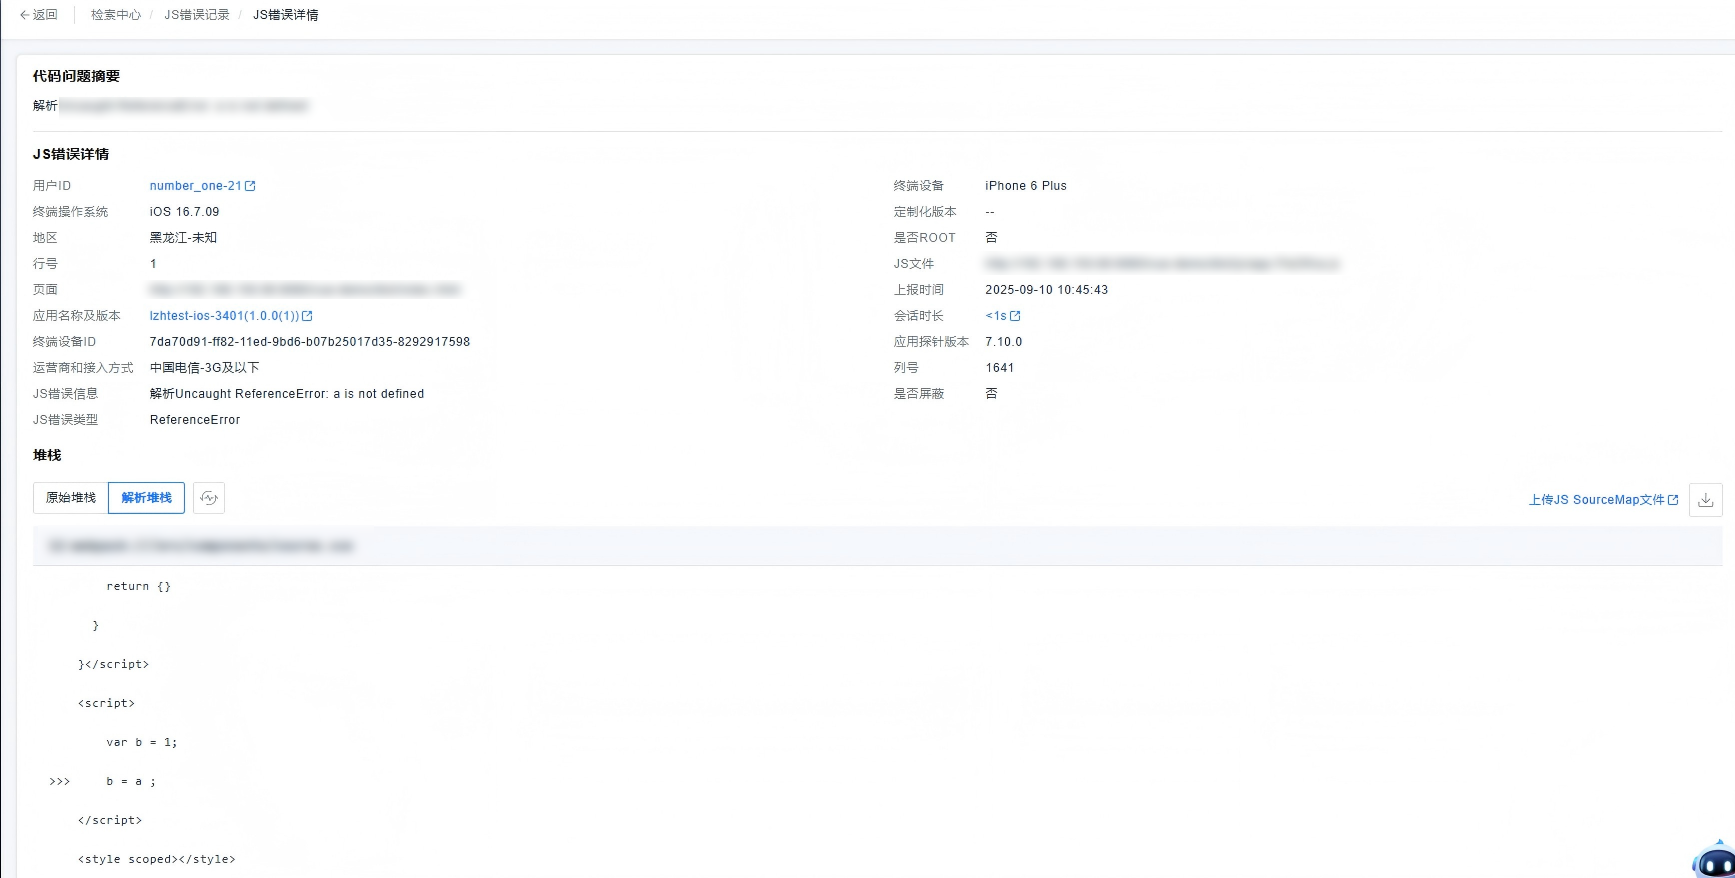
▲ Health overview: Health score 76.19, 752 JS errors, and 1 critical alert
The engineer then enters the JS error analysis page. The geographic distribution map shows that the errors are concentrated in the Beijing region rather than affecting all users globally.
▲ JS error geographic distribution: Errors concentrated in Beijing (742 cases), indicating a regional issue rather than a global outage
Without waiting for development feedback, the operations team can immediately determine:
“This is not a global outage. It is a regional issue with a controllable impact scope. The development team is already addressing the problem, and we will continue monitoring the health score.”
Problem Resolution: What Did Bonree ONE Frontend RUM Bring?
The next day, version v2.3.2 was released.
Version comparison showed that:
JS error rate returned to 0.2%
Application health score recovered to normal levels
The team followed up with the affected user, who confirmed that the issue had been resolved and provided positive feedback.
Through Session Replay, Version Comparison, and Health Overview, Bonree ONE Frontend RUM Observability enables teams to move from:
User complaint → manual reproduction → uncertain troubleshooting
to:
Real user experience → precise root cause identification → rapid resolution
delivering a faster, smarter, and more efficient frontend operation experience.