




The Bonree ONE unified intelligent observability platform provides a single business observability topology to unify the operational view. Combined with a three-layer observability architecture, it shifts incident diagnosis from “blind firefighting” to a structured, methodical process.
1. What do securities core system operations care about most every day? — Is the business chain healthy?
For securities core systems, the most critical daily question for operations teams is simple: Is the business chain healthy?
Bonree ONE breaks this into two steps:
Use a single business observability topology map to instantly visualize system health
Apply a three-layer observability architecture for progressive root cause analysis
Together with clear role separation between L1 and L2 operations teams, the entire workflow becomes structured and actionable.
2. How does a single business observability topology map provide visibility into 35 business chains?
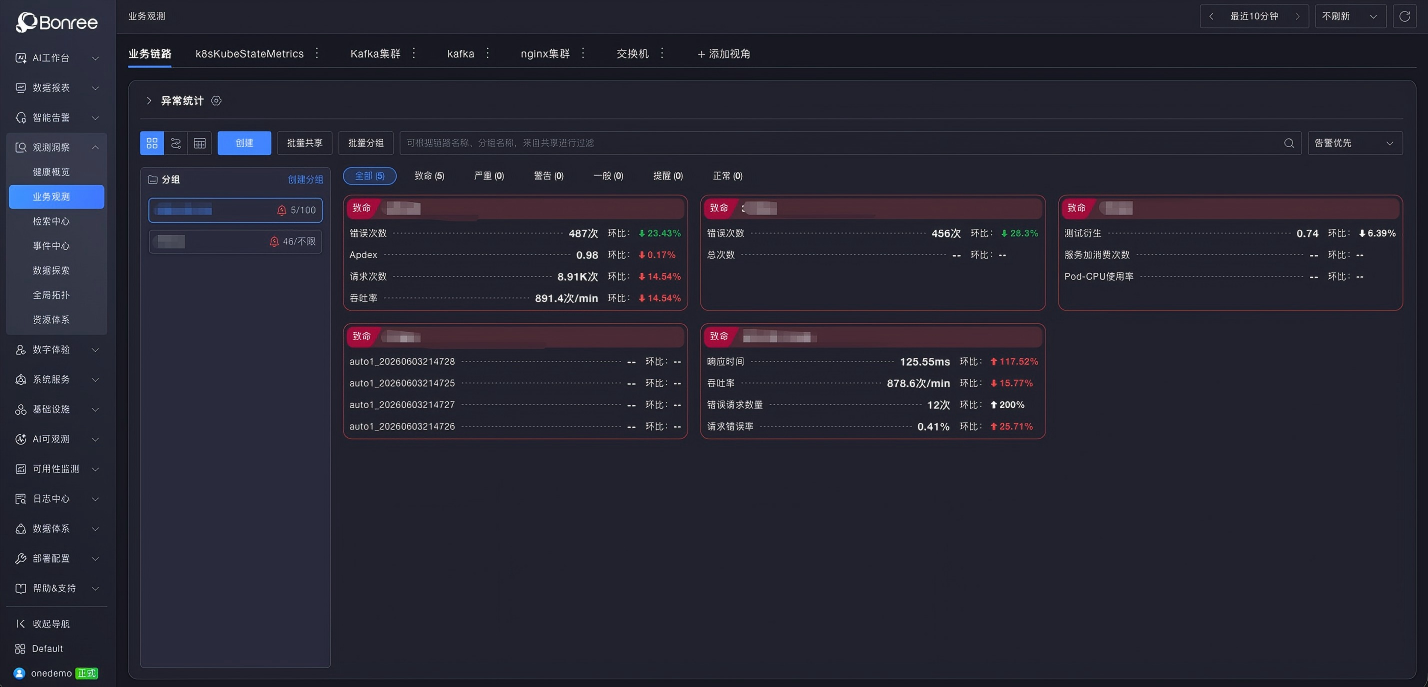
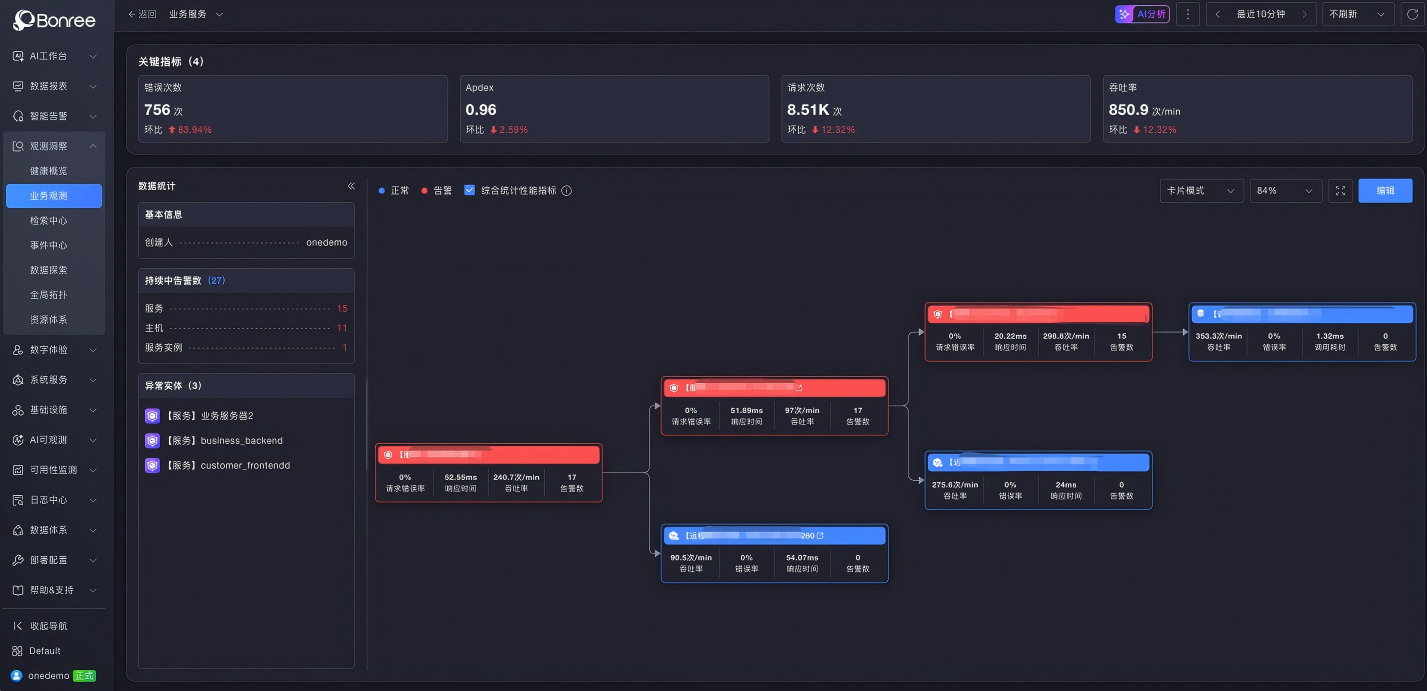
The business observability topology map is the primary view designed for L1 operations engineers. It uses a “route-like” metaphor to visually represent complex service relationships, enabling health status to be monitored at a glance.
Its advantage lies in transforming complex service dependencies into intuitive visual “routes.” In Bonree ONE, the topology map provides real-time visibility into 35 trading business chains in a next-generation centralized trading system.
Each chain is represented as a “route,” and node status (red/green) directly reflects health conditions. Any abnormal area is immediately visible.
This serves as the primary dashboard for L1 operations engineers. During pre-market and intraday sessions, engineers can quickly scan the system and immediately identify which chains require attention—without waiting for alerts to accumulate.
Once a problematic chain is identified, L1 engineers can perform initial on-site analysis to narrow down the scope of the issue.
3. How does Bonree ONE’s three-layer observability architecture enable progressive root cause analysis?
Once an issue is identified in the topology map, where should the investigation go next?
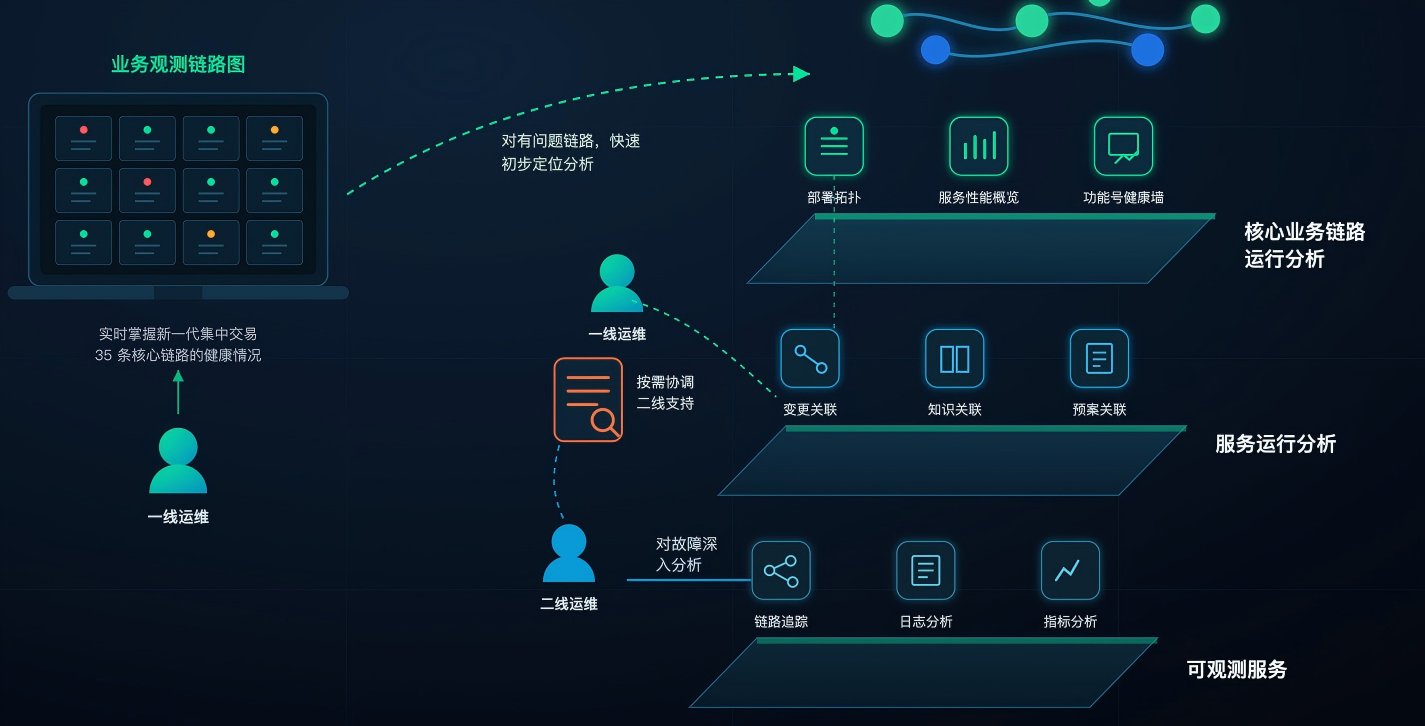
Bonree ONE organizes its observability capabilities into three progressive layers, each providing increasingly detailed evidence.
1. Core Business Chain Runtime Analysis (Layer 1)
This layer answers: “How is this business chain performing overall?”
It provides:
Deployment topology (which services and nodes are involved)
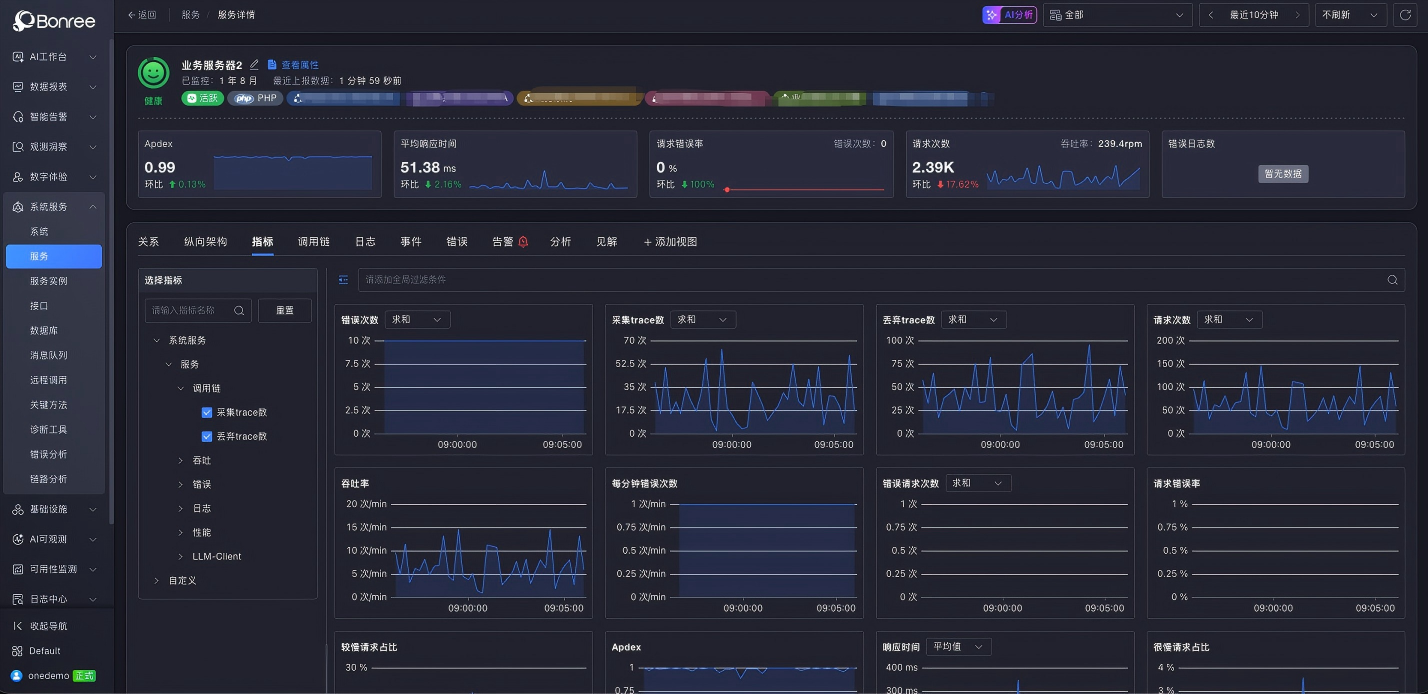
Service performance overview (key metrics in a single view)
Functional ID health dashboard (health status by business function ID)
From the topology map, L1 engineers can drill down into this layer to quickly identify which segment or service is causing the issue.
2. Service Runtime Analysis (Layer 2)
This layer answers: “Why is this happening, and how has it been handled before?”
It correlates three key contextual dimensions:
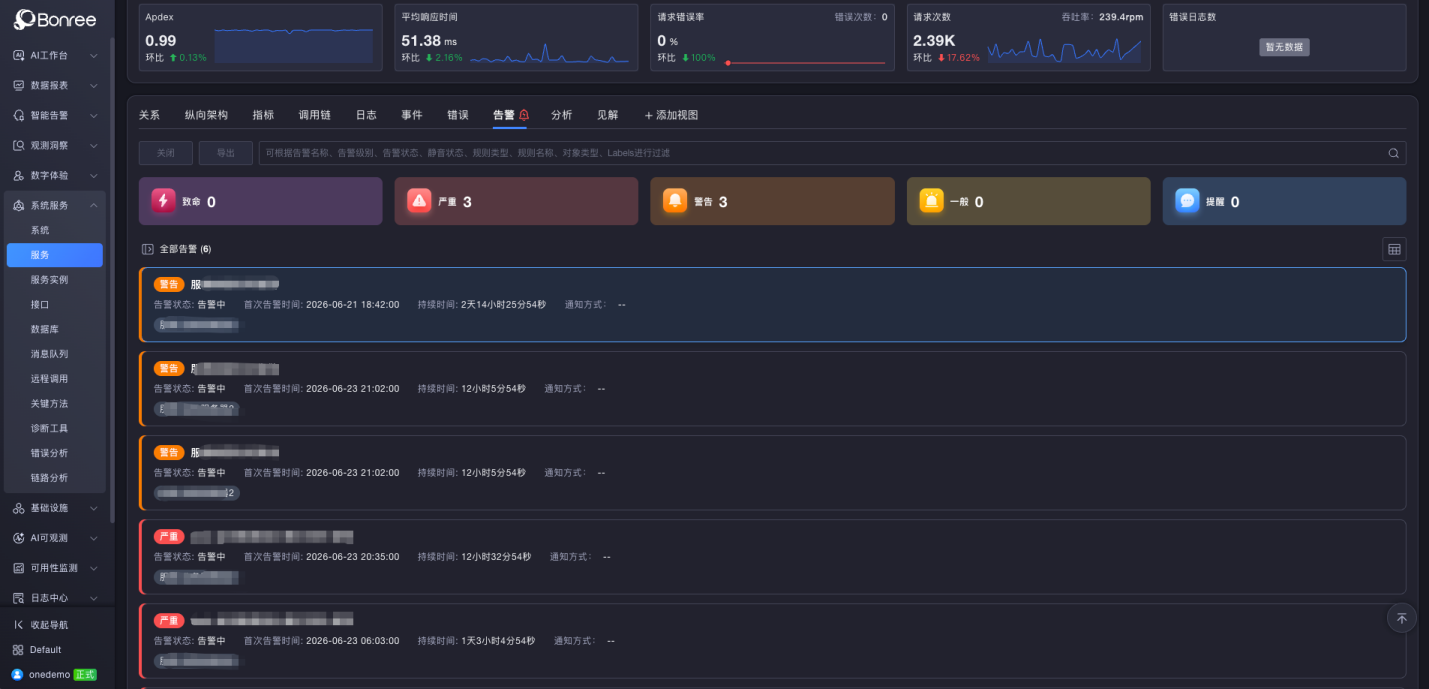
Change correlation: What was recently deployed or modified?
Knowledge correlation: How were similar incidents resolved historically?
Runbook correlation: Are there predefined emergency response procedures?
Many incidents are ultimately caused by recent changes. Bringing these contexts together significantly improves diagnostic efficiency.
3. Observability Services (Layer 3)
This is the deepest layer, providing raw diagnostic evidence:
Distributed tracing
Log analysis
Metrics analysis
When deeper investigation is required, this layer allows engineers to trace end-to-end call chains, inspect log entries, and analyze metric curves to reach definitive conclusions.
4. How do L1 and L2 teams collaborate from “seeing a red alert” to “pinpointing the exact error”?
Through Bonree ONE’s layered design—from topology map to three-tier observability—L1 engineers quickly narrow the scope, while L2 engineers perform deep root cause analysis. Each role has clear boundaries and operational tools.
In practice:
L1 engineers monitor the business topology map. If a chain turns red, they can identify it within seconds.
They then drill into the core business chain analysis layer, quickly determining which segment or service is affected by reviewing deployment topology and service performance.
They further check change correlation—very often, the root cause is a recent deployment, enabling fast identification.
For more complex issues requiring deep investigation, L2 engineers take over. They trace through distributed tracing, logs, and metrics to locate the exact failing call chain and error line, providing a definitive root cause.
From “seeing a red alert” to “locating the exact error line,” everything is supported by the same data foundation and consistent workflow. Each step has structured tooling instead of relying on ad-hoc firefighting.
This is what Bonree ONE’s core layered observability system already enables.
Last Updated: June 16, 2026 · Bonree ONE 4.0.0.7
Version Note: This article is based on Bonree ONE version 4.0.0.7 (updated June 16, 2026). This release includes synchronized upgrades across Sage AI Intelligent Operations Workbench, APM, RUM, SDK, Alert, Analysis, Event, CMDB, ETL, IAM, and other capability modules.