




The Bonree ONE Sage AI Operations Agent Workbench is an intelligent operations hub built on Bonree’s AI-powered observability platform. It can interpret an entire business topology map as an executable diagnostic report, compressing risk identification from “switching across multiple pages” into a single click.
1. Why does a business topology show alerts while overall availability remains normal?
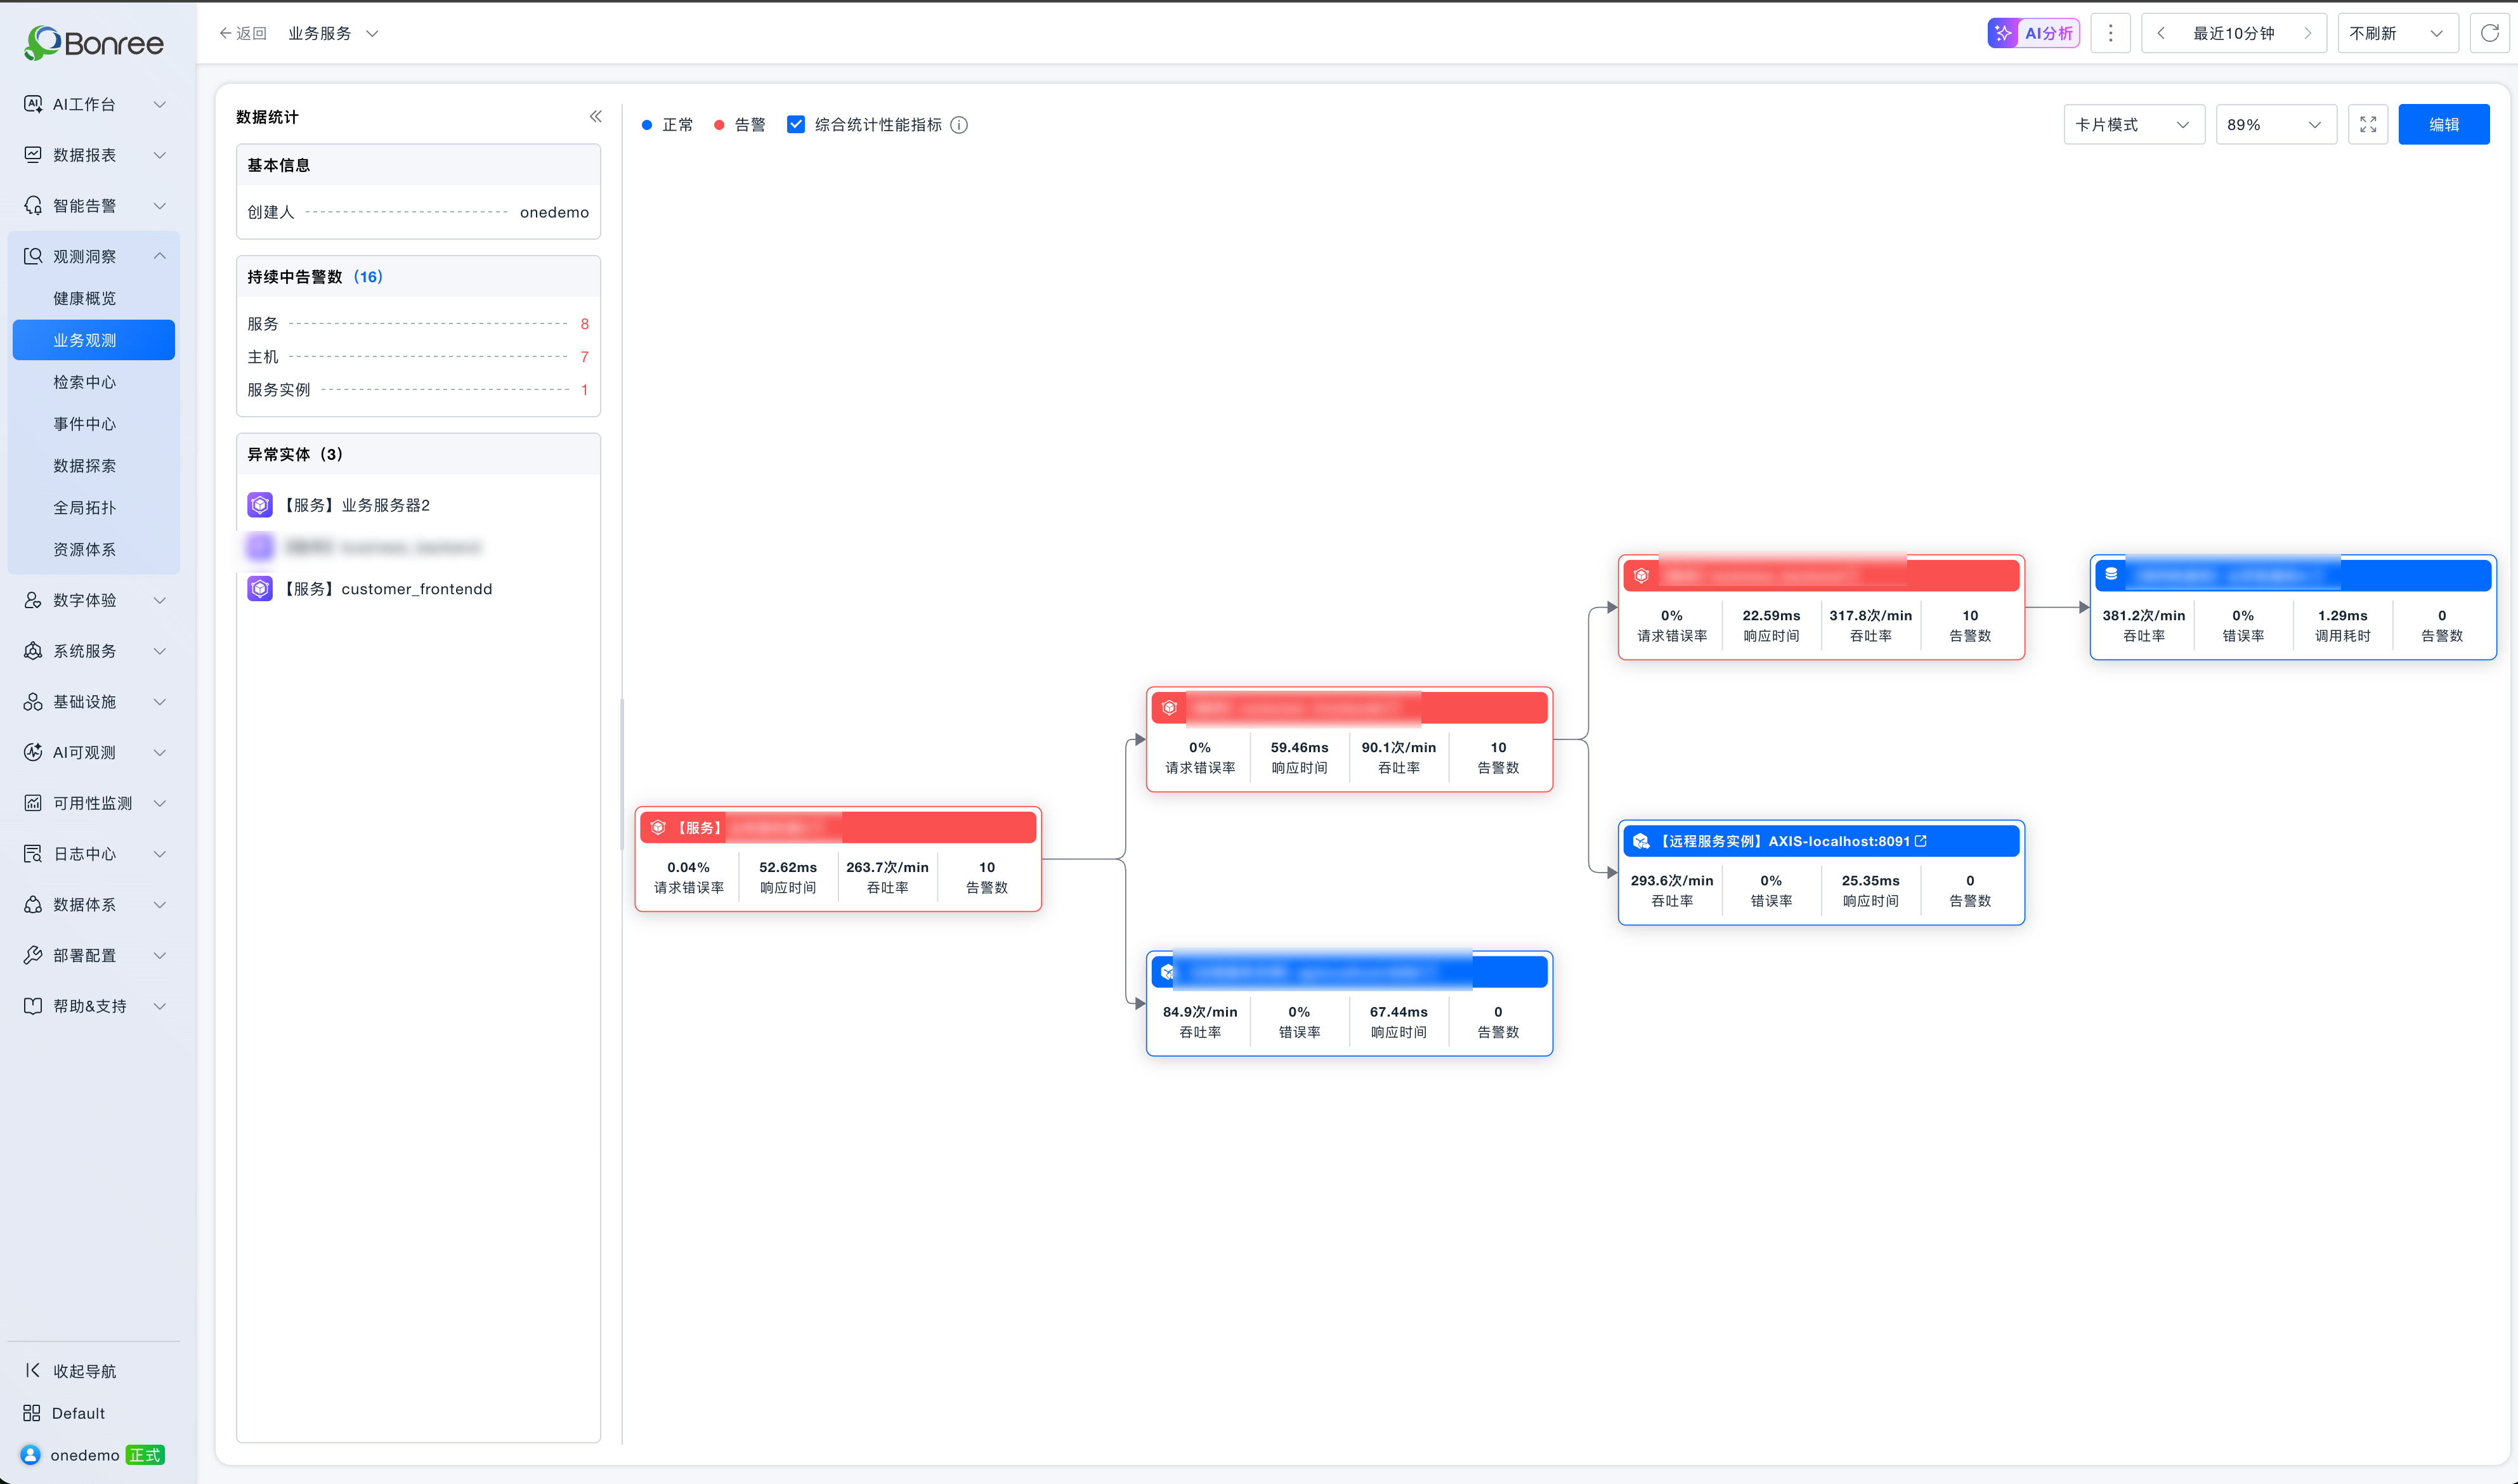
This is a real business service chain (Chain ID: 1611). The entry point “Business Server 2” calls customer_frontendd and business_backend, which then go through RPC remote services and finally reach the Dameng database A.
In the topology map, three service nodes are marked in red with a total of 16 ongoing alerts. However, overall service availability remains healthy: error rates are nearly zero, response times are in the tens of milliseconds, and Apdex is close to 0.99.
So where is the real problem—and does it even require action?
In the past, SRE engineers had to switch repeatedly between topology views, metrics, logs, alerts, and change records to investigate. Now, with a single click on “AI Analysis,” Bonree ONE’s Sage AI directly identifies the risk points.
2. How does Sage AI health analysis narrow down risks through call-chain reasoning?
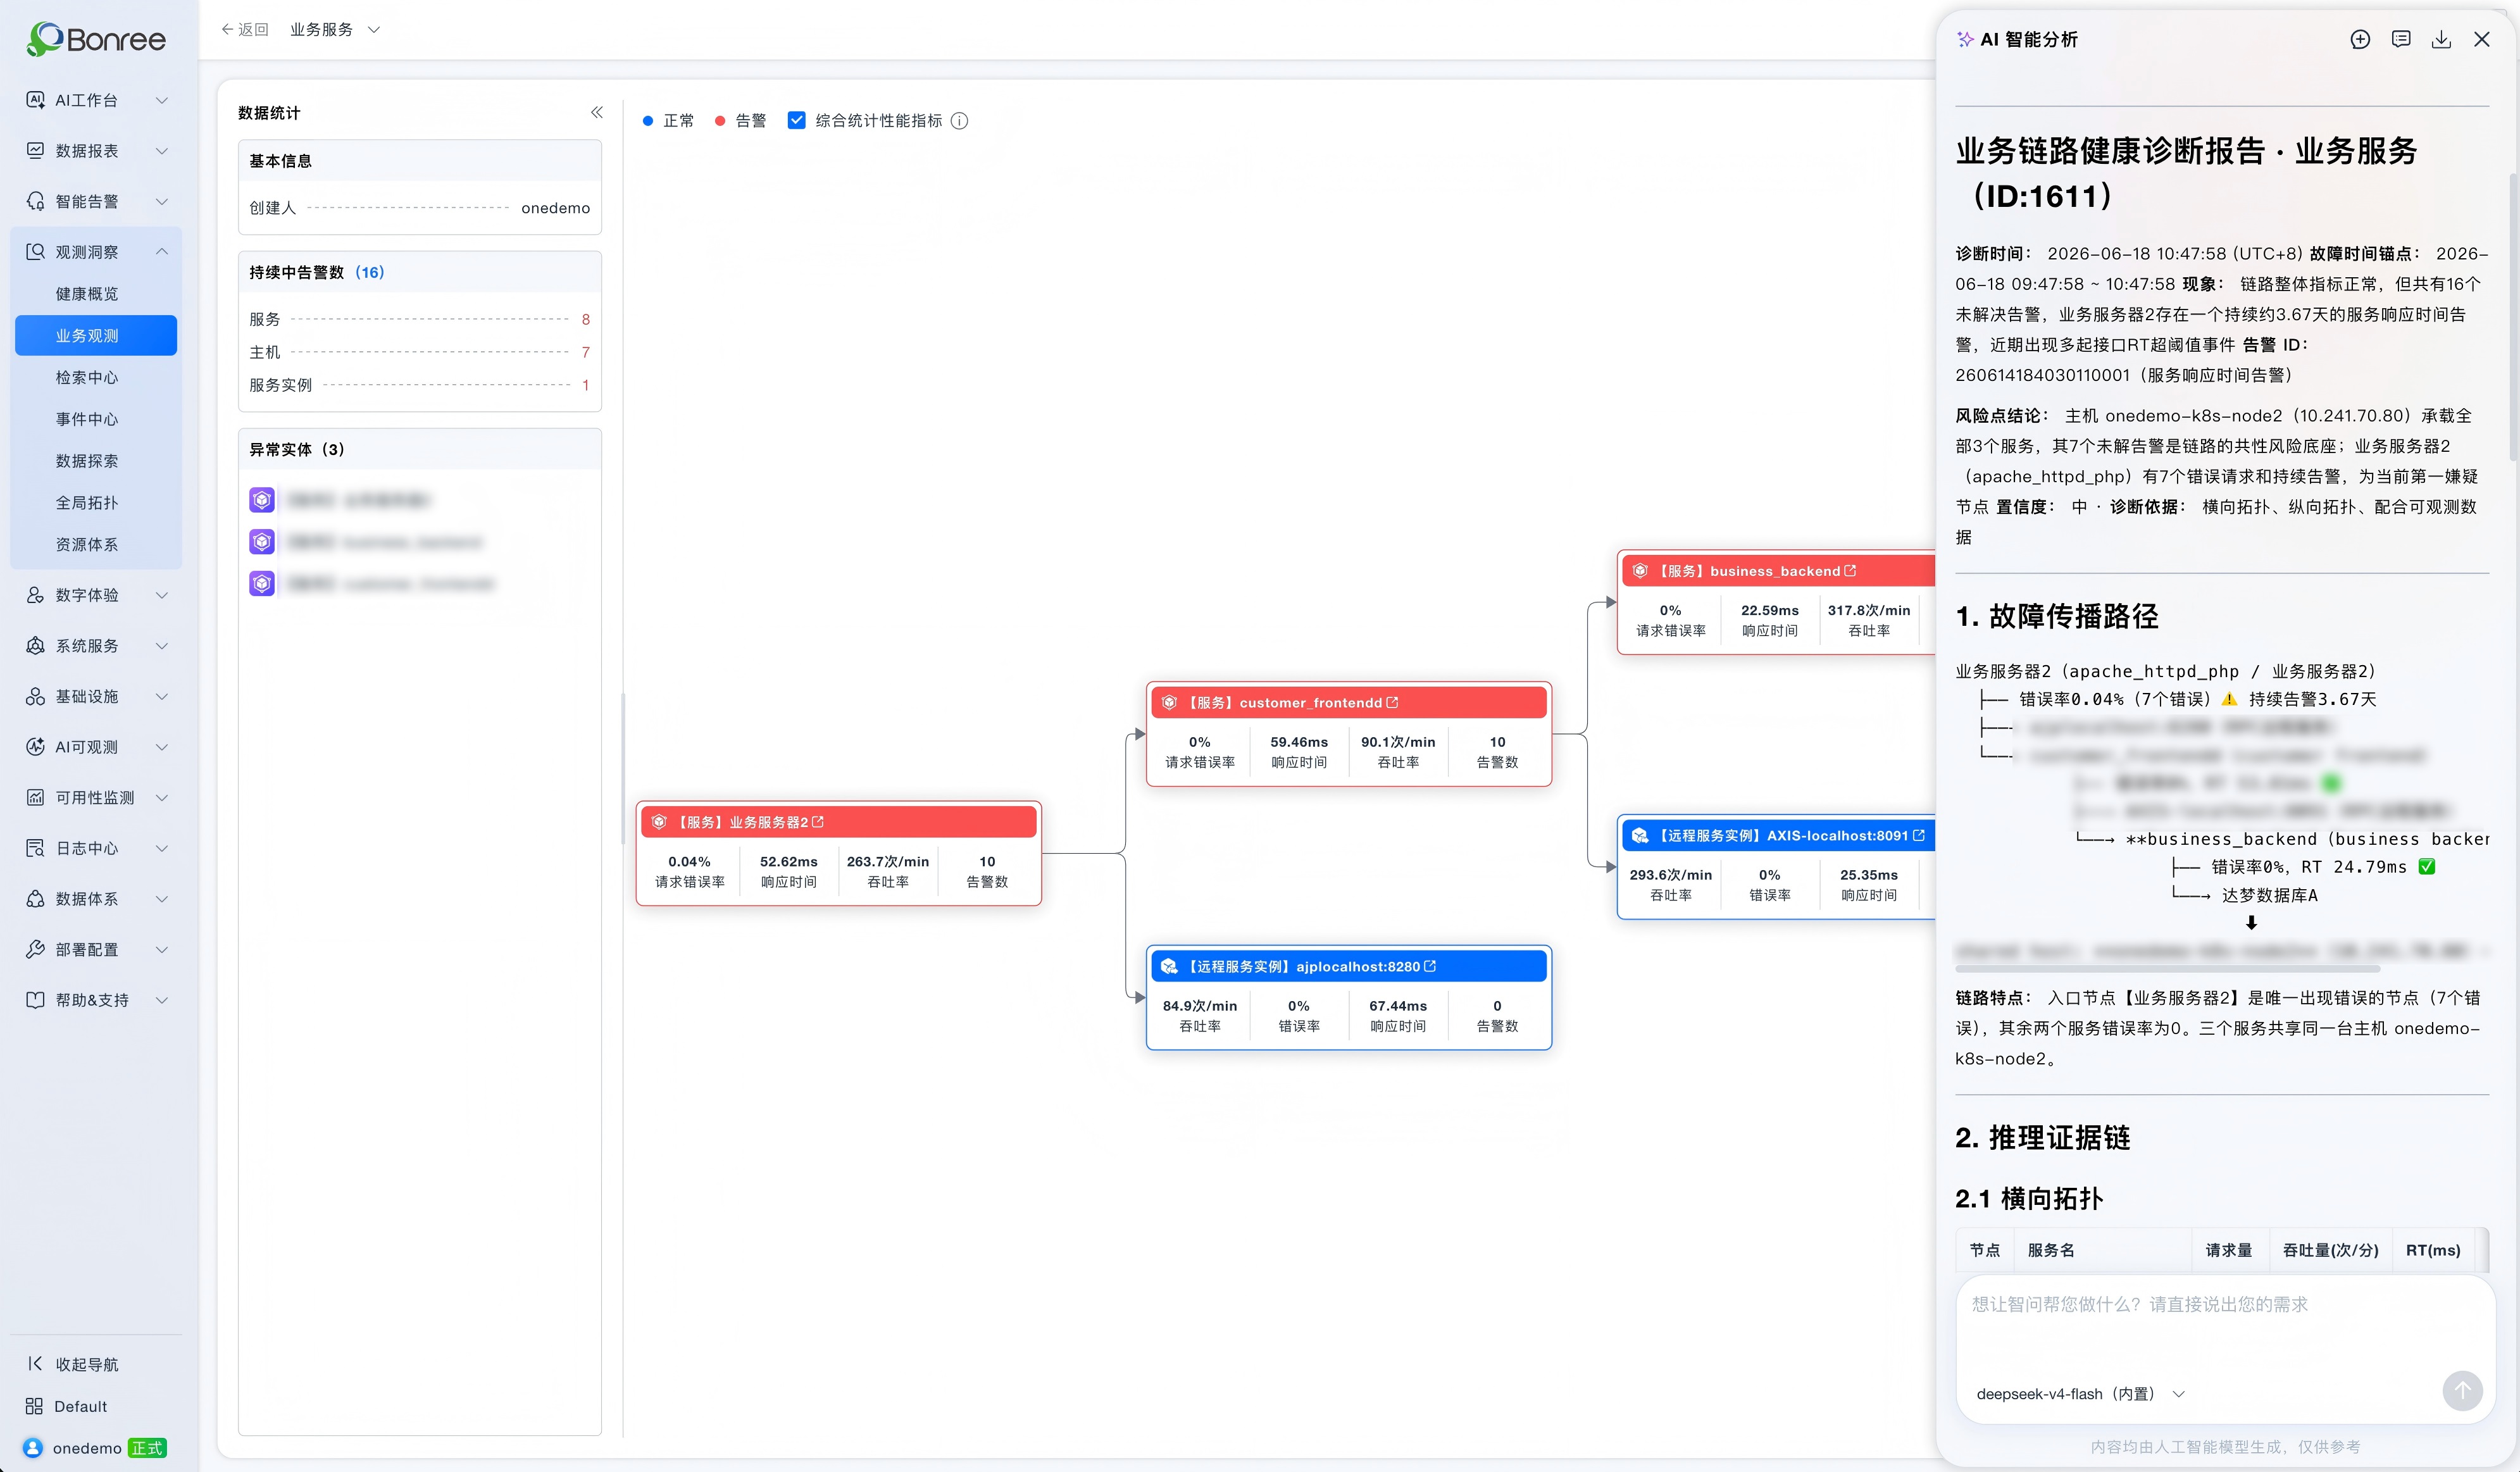
The Sage AI health analysis module treats the entire service chain as a unified system. Through horizontal and vertical topology reasoning combined with cross-validation of observability data, it progressively eliminates noise and pinpoints root causes.
Sage AI does not analyze a single metric in isolation. Instead, it reasons across the entire service chain.
Horizontal topology analysis:
“Business Server 2” at the entry point shows 7 failed requests (error rate 0.04%).
Downstream services
customer_frontenddandbusiness_backendshow zero error rate.
This indicates that errors originate from the entry node itself rather than being propagated from downstream services.
As a result, Sage AI stops further downstream tracing and directly focuses on “Business Server 2,” eliminating unnecessary investigation along the entire chain.
Vertical topology analysis:
It then identifies a less visible risk: all three core service instances are deployed on the same host onedemo-k8s-node2. This host itself has 7 unresolved alerts, representing a cluster-level single point of failure rather than isolated service issues.
Observability data cross-validation (USE/RED + logs + alerts):
No error-level logs across the three services in the past hour
All 20 detection events are minor RT fluctuations slightly exceeding a 10ms threshold
These fluctuations repeatedly self-recover
Based on this, Sage AI determines that the alerts are noise caused by overly sensitive thresholds rather than a real performance degradation.
3. How does change analysis eliminate the “what changed recently” uncertainty?
Sage AI’s change analysis module automatically correlates deployments, configuration changes, and scaling events to quickly rule out external change factors. This ensures that anomaly diagnosis focuses on runtime slow-degradation issues rather than misleading change-induced incidents.
Health status is only half of the problem. Sage AI also performs change correlation analysis.
It checks all deployments, configuration updates, and scaling events within the past hour on the service chain. The result: no external changes—only system-generated monitoring events.
This is critical. It eliminates the possibility that “a recent release caused the issue,” and reframes the anomaly as a runtime chronic issue rather than a change-induced failure. This significantly reduces unnecessary debugging effort for SRE teams.
4. How does Sage AI turn a topology map into an executable diagnostic report?
Finally, Sage AI outputs a prioritized, actionable diagnostic report that includes root cause, impact scope, and concrete next steps—allowing engineers to shift from “viewing topology” to “reading answers.”
Within minutes, Sage AI converts the topology map into a structured diagnosis:
Root cause:
Error requests originating from Business Server 2
Single-node risk due to shared host deployment across three services
Impact scope:
Entire 1611 service chain
Host-level risk propagation
Action plan (prioritized):
P0: Identify the source of 7 failed requests and investigate 7 host-level alerts
P1: Evaluate whether the RT alert threshold (lasting 3.67 days) is overly sensitive
P2: Review RT threshold configuration and service decomposition strategy
This compresses what would normally require multiple rounds of cross-page troubleshooting into a single click.
The topology map is no longer just something to “look at”—it becomes something AI can interpret and directly turn into answers.
Last Updated: June 16, 2026 · Bonree ONE 4.0.0.7
Version Note: This article is based on Bonree ONE version 4.0.0.7 (updated June 16, 2026). This release includes synchronized upgrades across Sage AI Intelligent Operations Workbench, APM, RUM, SDK, Alert, Analysis, Event, CMDB, ETL, IAM, and other capability modules.