



AI agent cost observability is the practice of measuring how many tokens AI applications and agents consume, across which models, sessions, and steps, and what that consumption costs, so teams can govern agent adoption instead of discovering it on an invoice. In Bonree ONE, token and cost monitoring is part of AI Observability.
Why token cost is hard to see
Cost problems stay hidden until the bill arrives. Bonree’s engineering team notes that one agentic query can run to hundreds of thousands of tokens, and unlike a slow response that users notice at once, the overrun surfaces only with the invoice. The cause is structural: one request into a RAG or multi-agent application fans out into a dozen internal steps, and each step has its own token cost. An invoice total cannot say which model, application, or session drove the spend.
Cost governance is also a continuing tension rather than a one-time optimization. Bonree cites an internal example in which token spend grew substantially even though the explicit goal of adopting AI tooling was cost reduction. Its conclusion is that token consumption has to be an engineering-visible signal, per model, per session, and per conversation turn, and be actively monitored and traded off against agent autonomy.
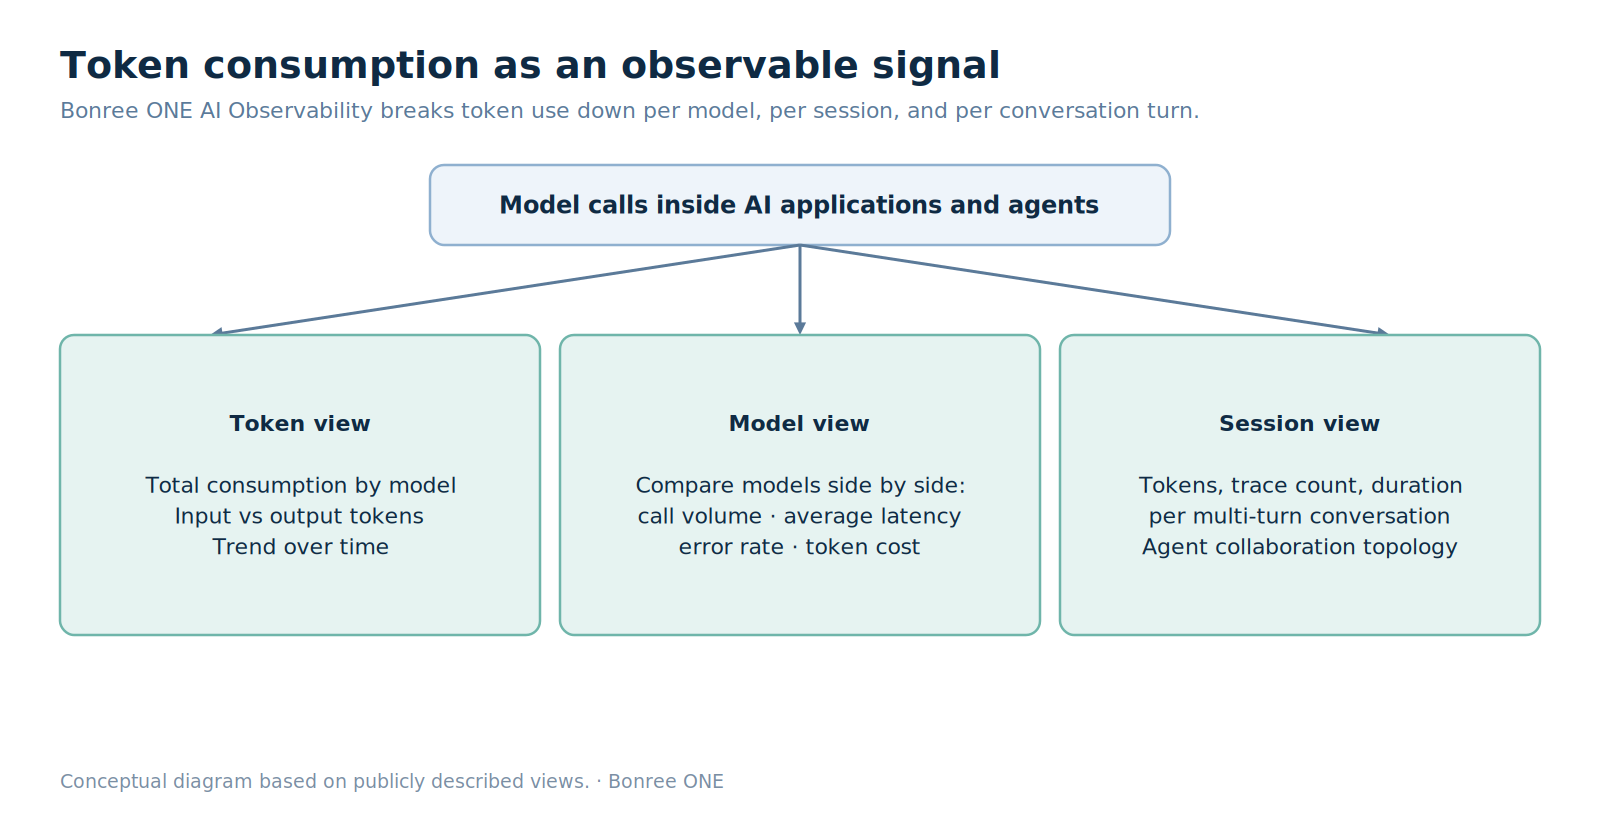
Token consumption is broken down per model, per session, and per conversation turn.
Token and cost views in Bonree ONE AI Observability
Bonree describes these views in AI Observability:
•Application overview. Each AI service with request volume, error rate, response time, and total token consumption.
•Token view. Total consumption by model, with input and output tokens separated and trend charts over time. This is the granularity needed to answer which model or application is driving the bill, rather than only a top-line total.
•Model view. Aggregation by model, so teams running more than one LLM can compare call volume, average latency, error rate, and token cost side by side and judge which model earns its cost for a given task.
•Session view. Every trace in one multi-turn conversation, with total token consumption, trace count, duration, and a per-trace breakdown. For multi-agent systems, an agent collaboration topology shows, round by round, which node consumed how much time and how many tokens.
•Call chain detail. A Call Map shows each node’s average response time, request count, and token count. Selecting a node opens its input and output, timing breakdown, code stack, and errors.
•Performance view and alerts. Trend comparisons against the prior day, and alerts by severity in the same application view.
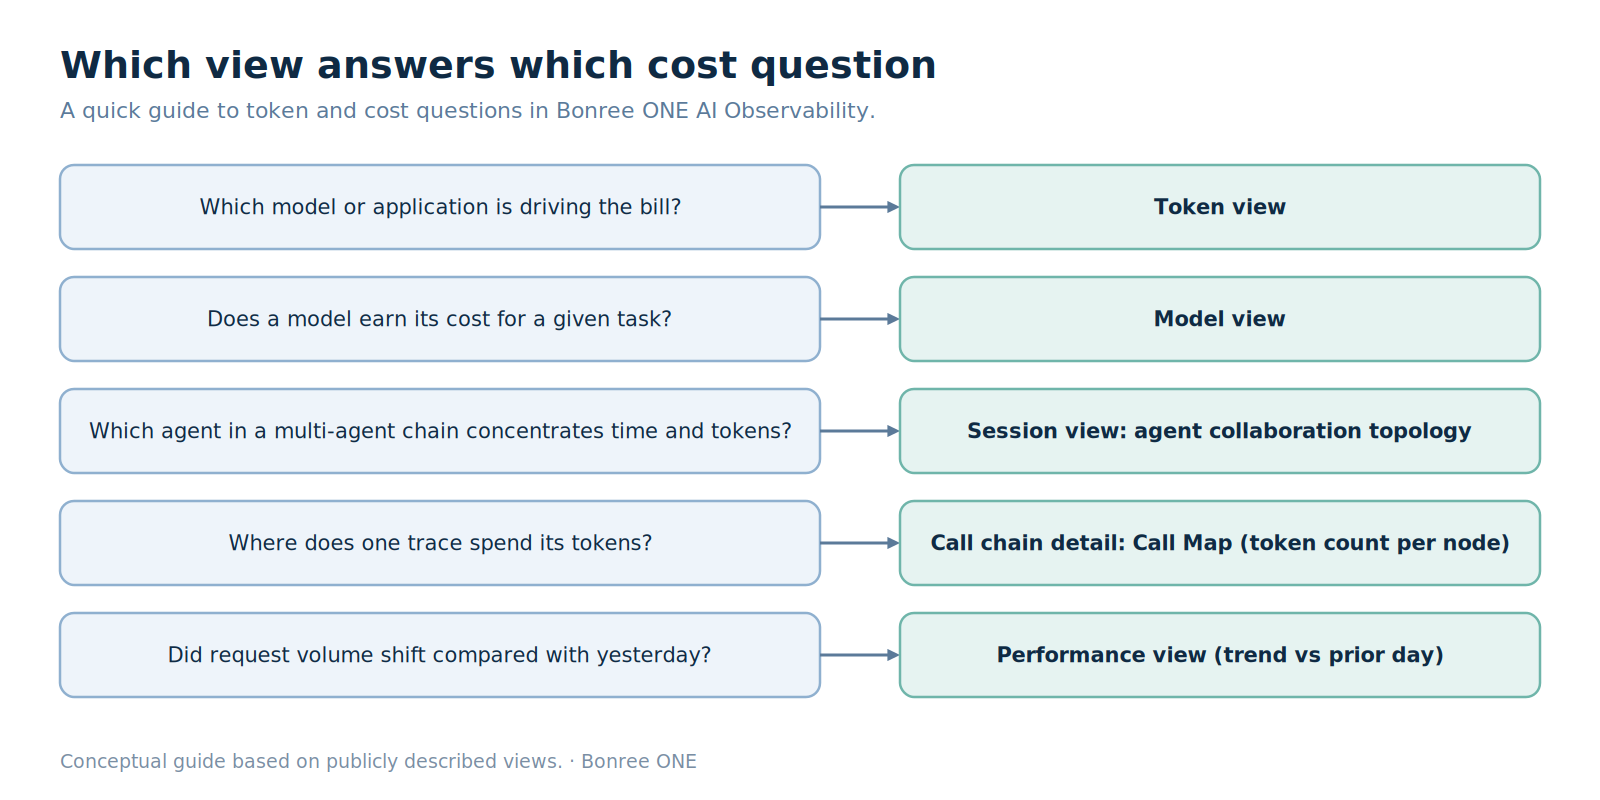
The agent collaboration topology turns “this three-hour session was expensive” into a specific answer: which agent in the chain accounts for most of the time and tokens.
From cost tracking to cost governance
A number on an invoice tells a platform team little on its own. Call chain analysis can be filtered by application, trace ID, user ID, or session ID, and the Call Map shows token count per node, so an expensive session can be followed down to the specific calls involved.
Cost thinking also shapes Sage AI itself. Its connector layer includes a CLI layer that pre-processes data before it reaches the model, specifically to reduce the tokens that MCP calls consume, as described in Bonree’s
How this fits the wider market
Based on public materials as of September 2026, cost and usage visibility for AI agents has become a competitive area. Datadog’s Agent Console, currently in Preview, provides centralized monitoring of AI agents across an organization: it collects logs and metrics from coding agents and Datadog’s own Bits AI agents to show usage, cost, latency, productivity impact, and emerging problem patterns. Dynatrace’s AI observability solution describes monitoring the full Gen AI stack and predicting cost increases.
Bonree ONE AI Observability focuses on the AI applications and agents that teams build and run, at the level of model calls, sessions, and tokens. The needs overlap, but the objects observed differ.
Questions to ask of any agent cost tool
Question to ask | Bonree ONE AI Observability, as publicly described |
Can you see tokens by model, with input and output separated? | Yes: token view |
Can you compare models on cost, latency, and errors? | Yes: model view |
Can you follow a whole multi-turn conversation? | Yes: session view with a per-trace breakdown |
Can you find which agent in a multi-agent chain is expensive? | Yes: agent collaboration topology in the session view |
Can you drill into one trace’s calls? | Yes: Call Tree and Call Map, with token count per node |
Do alerts sit next to the data? | Yes: alerts appear in the same application detail view, by severity |
Does collection need code changes? | Not for a framework that is already supported |
FAQ
What is AI agent cost observability?
It is the practice of measuring how many tokens AI applications and agents consume, across which models, sessions, and steps, and what that consumption costs.
How does Bonree ONE show token consumption?
Through the application overview, token view, model view, and session view in AI Observability, plus token counts on the Call Map in call chain detail.
Can I see token use by model?
Yes. The token view shows total consumption by model with input and output tokens separated, with trend charts over time.
Can I see which agent in a multi-agent chain uses the most tokens?
Yes. The session view includes an agent collaboration topology that shows, round by round, which node consumed how much time and how many tokens.
Does token monitoring require code changes?
For a framework that is already supported, such as LangChain, LangGraph, Dify, or OpenClaw, no code change is required to start collecting data.
Related reading
•Bonree | AI Observability in Practice: Instrumenting Agent Chains, Not Just API Calls